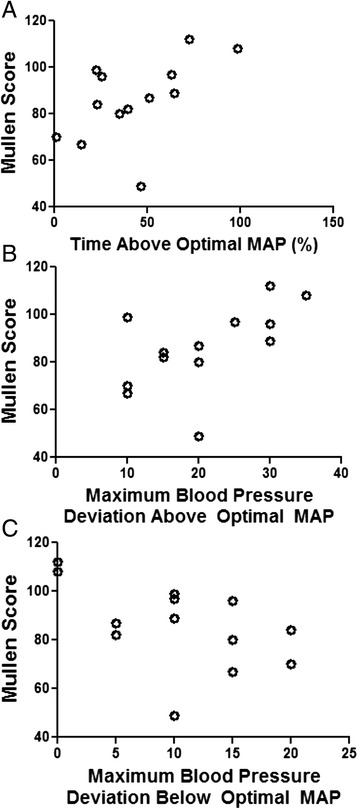
Fig. 6.

Blood pressure in relation to the optimal mean arterial blood pressure (MAP) during the neonatal rewarming period and the Mullen score at approximately 2 years of age. Higher Mullen scores correlated with a greater percentage of the rewarming period spent with blood pressure above optimal MAP (n = 13; r = 0.560, p = 0.044; a) and greater maximal blood pressure deviation above optimal MAP (n = 13; r = 0.585; p = 0.035; b). Lower Mullen scores correlated with greater maximal blood pressure deviation below optimal MAP (n = 13; r = –0.563; p = 0.044; c). Data were analyzed by Spearman correlations. Each circle represents one child
