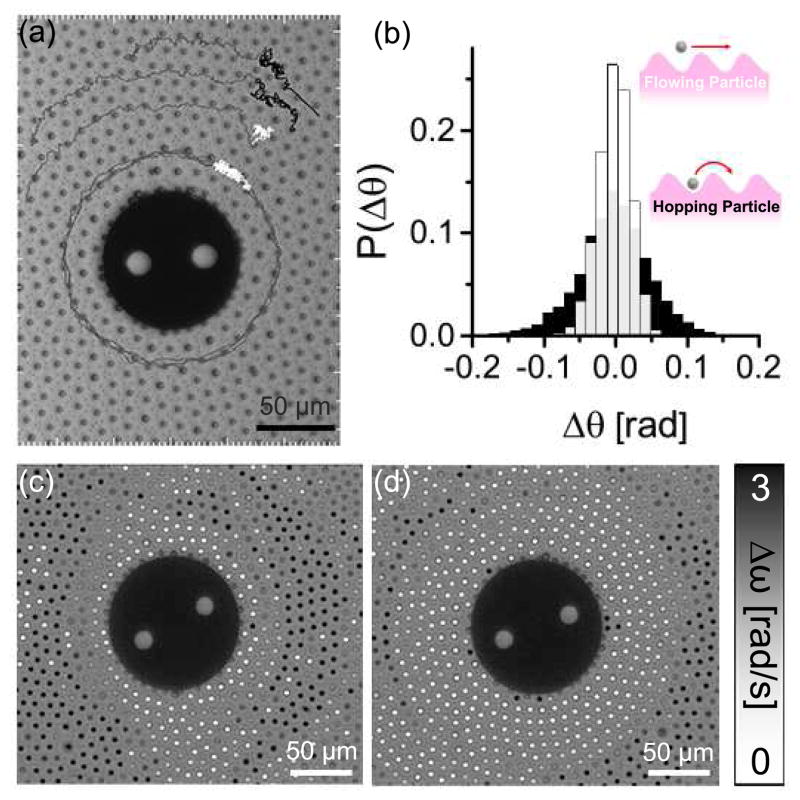
Fig. 3.
(a) Examples of trajectories in the lab (dark grey lines) and in the co-moving reference frame of the flow (black HR and white FR) for a monolayer sheared at 0.3 Hz. (b) Probability distributions of the angular displacements in the co-moving reference frame for two particles with initial radial positions r/R = 1.3 (white, FR) and 2.4 (black, HR). Ω/2π = 1.2 Hz and the displacements are measured over 700 frames. (c–d) Δω (angular velocity in the co-moving frame) for all particles in the monolayer for two snapshots of increasing Ω: (c) Ω/2π = 0.1 Hz and (d) Ω/2π = 0.3 Hz. Particles are colored according to their individual values of Δω relative to the grey-scale on the right. Increasing Ω, more particles enter the FR.

