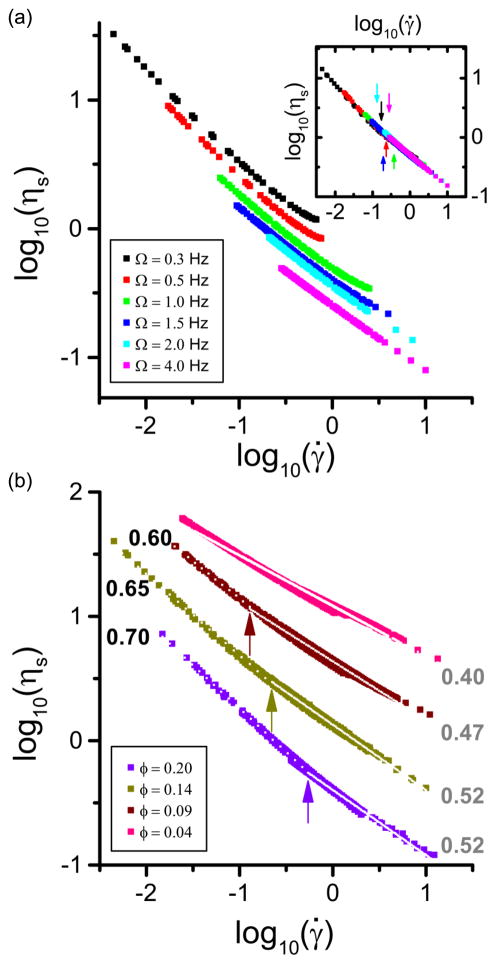
Fig. 5.
(a) Log-log plot of the surface viscosity corresponding to the profiles in Fig. 4 (colors are chosen accordingly) as a function of the local shear rate. Inset: Master flow curves obtained shifting all the curves on top of each other. (b) Master flow curves calculated for all densities and shifted for clarity. The lines and the numbers show power-law fits and (absolute) exponents in the FR (solid lines, grey numbers) and in the HR (dotted lines, black numbers). Arrows denote the average position of the FR-HR transition.

