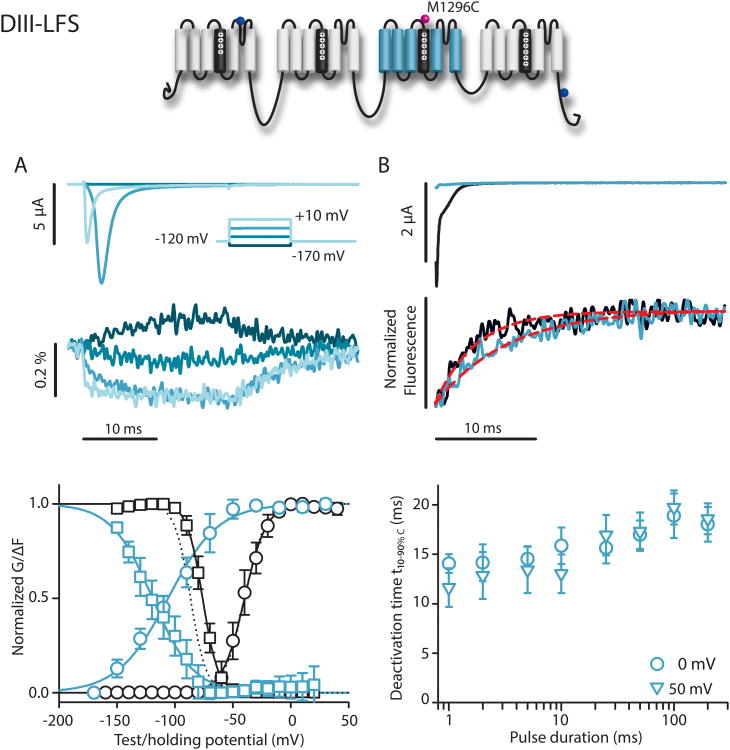
Figure 4.
DIII-LFS (M1296C) ionic currents and fluorescence. Na+ currents and fluorescence from DIII-LFS. Mean±95CI is reported for groups of 5 to 17 cells. A) Top: Ionic currents (above) and fluorescence (below) were recorded during 20 ms pulses ranging from -170 to +30 mV in 20 mV steps. For clarity, only traces corresponding to -170, -110, -50, and +10 mV are shown. Bottom: G-V (black circles), SSI (black squares), and the corresponding fluorescence signals (blue circles and squares, respectively). Curves were constructed as in Figure 2. Boltzmann-fit parameters in Table 1. For comparison, dotted lines represent WT G-V and SSI curves. B) Tail currents and fluorescence measured following the step back to -120 mV from depolarizing steps to +50 mV for 2 (black) or 200 ms (green) pulses. Red dotted lines indicate exponential fits to the fluorescence traces. Time constants for this cell were 4.1 and 7.5 ms after 2 and 200 ms-long depolarizations, respectively. t10-90%,C values calculated from deactivation time constants of the fluorescence signal from exponential fits following the step back to -120 mV, from depolarizing steps to 0 or +50 mV for 1 to 200 ms durations.

