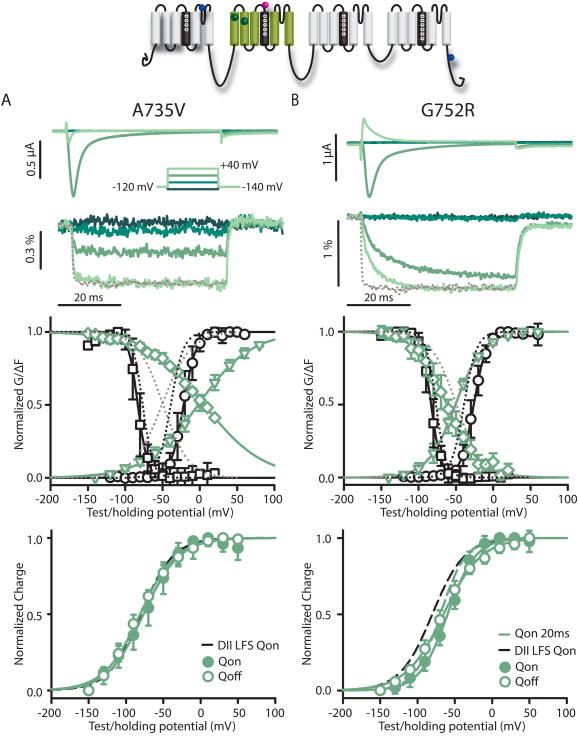
Figure 6.
DII-LFS-A735V and DII-LFS-G752R Brugada syndrome mutants. Na+ currents and fluorescence were recorded from A735V (left panels) and G752R (right panels) mutations in the DII-LFS background. Mean±95CI is reported for groups of 3 to 8 cells. Ionic currents (top) and fluorescence (below) from DII-LFS-A735V (A) and DII-LFS-G752R (B) channels were recorded during 50 ms-long pulses ranging from -140 to +60 mV in 20 mV steps. For clarity, only -140, -80, -20 and +40 mV traces are shown. Kinetics of VSD activation in DII-LFS-A735V and DII-LFS-G752R channels are tracked by the fluorescence signal. For comparison the gray dotted line represents a normalized signal from DII-LFS recorded at +40 mV. G-V (black circles) and SSI (black squares), and the corresponding fluorescence signals (green circles and squares, respectively) for DII-LFS-A735V and DII-LFS-G752R channels. For comparison, dotted lines represent DII-LFS curves. Voltage-dependence of integrated gating charge movement over 10 ms for A735V and G752R channels. Dashed black line indicates the Q-V function of the ON gating current of WT-LFS for reference. For G752R, dashed green line shows gating charge calculated from a 20 ms interval.

