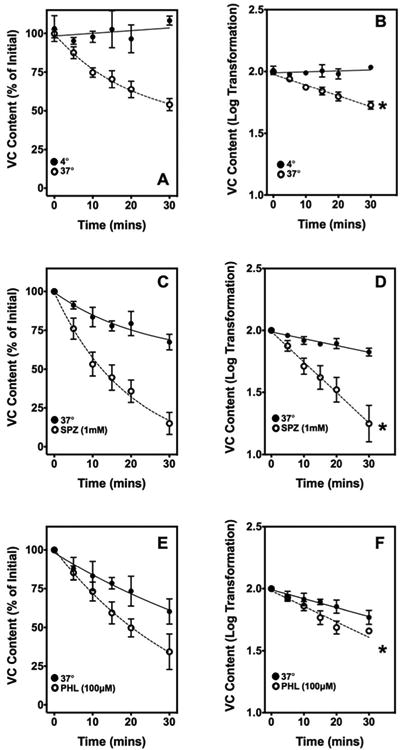
Figure 4. Time-dependent spontaneous VC Efflux.

Time course of spontaneous VC efflux. [A] Relative VC content over 30 min at 4°C (closed circles) and 37°C (open circles). The initial synaptosomal VC concentration was ∼250-300 nmol/g (n=6). [B] Logarithmic transformation of data in panel A. [C] Relative VC content over 30 min of efflux at 37°C with (open circles) and without (closed circles) 1 mM sulfinpyrazone (n=4). [D] Logarithmic transformation of data in panel C. [E] Relative VC content over 30 mins of efflux at 37°C with (open circles) and without (closed circles) 100 μM phloretin (n=4). [F] Logarithmic transformation of data in panel C. In all the log-transformed panels, an asterisk (*) denotes a significant difference between the slopes of the two lines (p<0.05).
SPZ, sulfinpyrazone; PHL, phloretin; VC, Vitamin C
