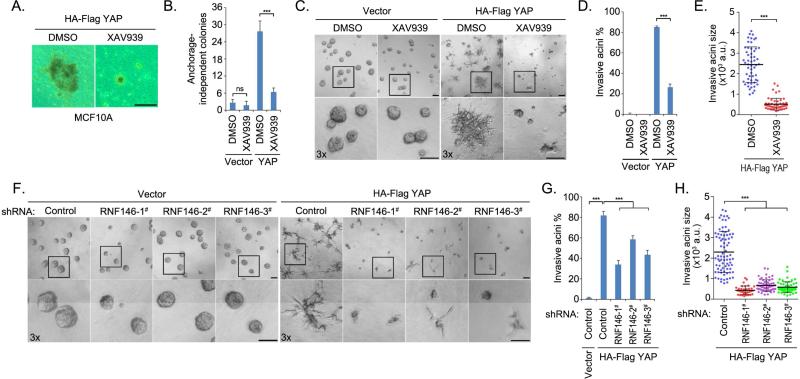
Figure 5. Tankyrase inhibitors targeted the oncogenic functions of YAP.
(A-B) XAV939 treatment suppressed the anchorage-independent growth of YAP-transformed MCF10A cells. Vector- or YAP-overexpressing MCF10A cells were subjected to soft agar assay and treated dimethyl sulfoxide (DMSO) or XAV939 (30 μM) for 4 weeks. Representative colonies are shown (A) and were quantified (B). Data are presented as means ± standard deviation (s.d.) from three independent experiments. (C-E) XAV939 treatment inhibited YAP-induced MCF10A invasive acini formation. Vector- or YAP-overexpressing MCF10A cells were subjected to 3D culture in matrigel and were treated with DMSO or XAV939 (30 μM) for 5 days. Representative acini are shown (C). The percentage (D) and the size (E) of invasive acini are quantified. Data are presented as means ± s.d. from three independent experiments. a.u., arbitrary unit. (F-H) Loss of RNF146 suppressed YAP-induced MCF10A invasive acini formation. Vector- or YAP-overexpressing MCF10A cells transduced with control or one of three RNF146 shRNAs were subjected to 3D culture in matrigel and treated with DMSO or XAV939 (30 μM) for 5 days. Representative acini (F) and quantification of percentage (G) and size (H) of invasive acini are shown. Data are presented as means ± s.d. from three independent experiments. a.u., arbitrary unit. For all the panels, ns, not significant; *** p<0.001; Scale bar, 100μm.

