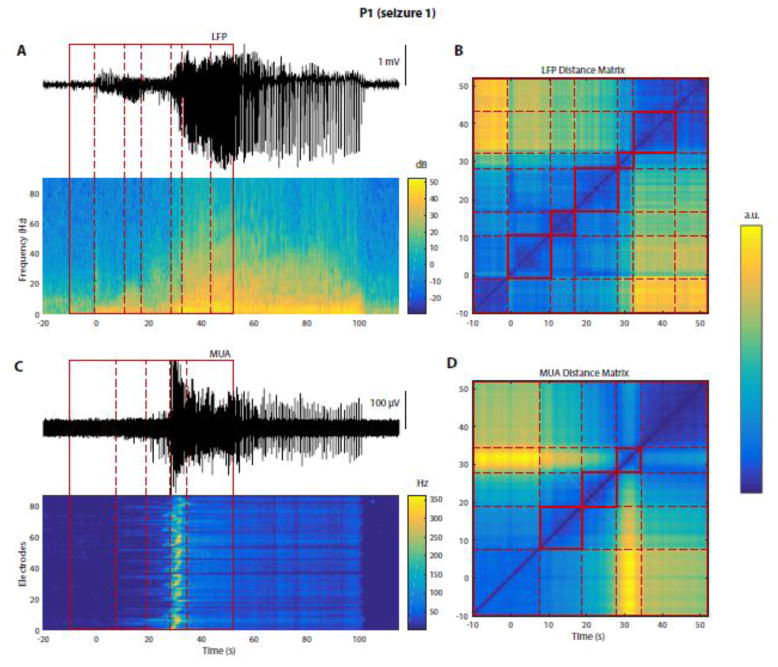
Figure 2. Seizures can be segmented into distinct stages based on LFPs or MUA.
All data on this figure are from P1, seizure 1. (A) Top trace: LFPs from a representative electrode. Heat map below: corresponding multitaper spectrogram (see Materials and Methods). Red box (solid lines): time period manually selected for segmentation, encompassing seizure onset (indicated by t = 0 s, based on visual inspection). Dashed red lines: results of a semi-automatic segmentation algorithm (see Materials and Methods) applied on LFPs, and dividing the seizure into different stages. (B) LFP-based distance matrix used by the segmentation algorithm to find transitions between different segments/stages. Each axis: time period within the red box in (A). The color of each point (ti, tj) represents the “distance”, or dissimilarity, between the multichannel LFPs recorded at the two times ti and tj, based on spectral features obtained from LFPs. Dashed red lines: limits of the different stages found by the algorithm, and also shown in (A). (C) Top trace: high-pass MUA from the same electrode as in (A). Heat map: MUA rate (in 1-s bins) over time (x-axis) and across electrodes (y-axis, ordered row-wise across the MEA). Red box: same as in (A). Dashed red lines: results of the segmentation algorithm applied to MUA data. Note the differences between the segmentations based on LFPs and MUA. (D) MUA-based distance matrix used by the segmentation algorithm. This panel is similar to (B) but with features derived from MUA instead of LFPs.

