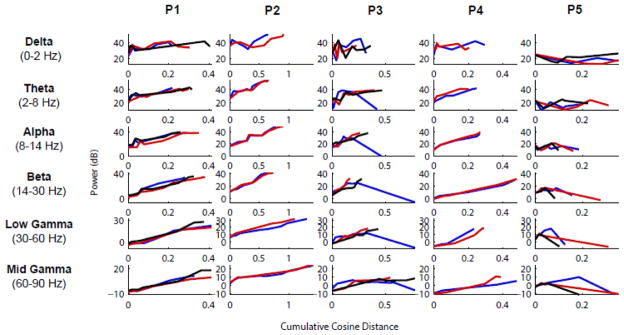
Figure 7. Band-specific LFP power and spatial patterns change across stages but their evolution is similar within a given patient.

For each frequency band investigated (delta, theta, alpha, beta, low-gamma, mid-gamma) and each patient, the variations in LFP overall power and spatial structure were quantified similarly to the MUA (Fig. 5C). Specifically, the y-axis shows the electrode- and time-averaged band-filtered LFP power during each stage, and the x-axis shows the cumulative cosine distance between the band-filtered LFP power maps across consecutive stages. With only a few exceptions, the profiles are very similar among seizures within the same patient, as also shown before based on MUA analysis (Fig. 5). We note also a general increase in power throughout seizure early propagation, and a larger degree of spatial reorganization in high frequencies compared to low frequencies.
