
Fig. 2.
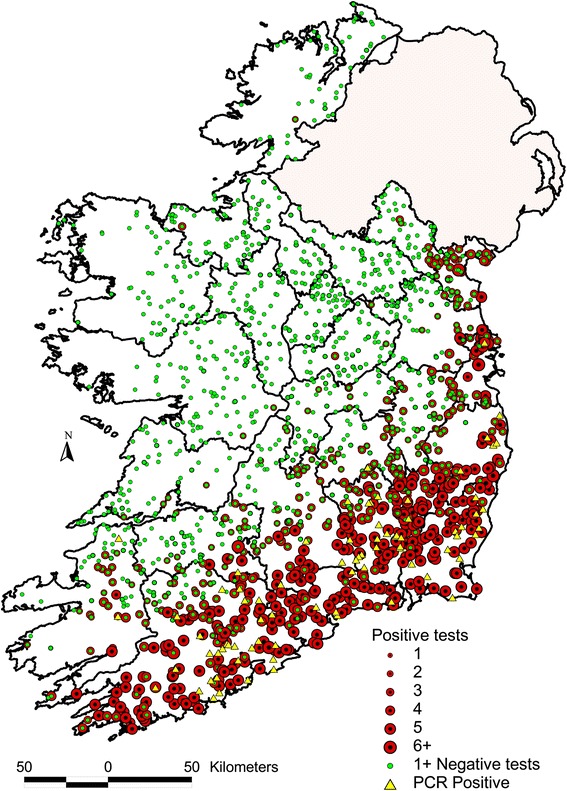
Spatial distribution of samples collected through pathology based and serological based SBV surveillance in Ireland during 2012 and 2013. The location of RT-qPCR-positive animals, which were submitted to veterinary laboratories between 30 October 2012 and 9 May 2013, is presented as yellow triangles. The green and red dots highlight the location of farms enrolled in the 3 serological surveys during November 2012 to November 2013, with colour and size relating to the number of animals per farm that were positive to SBV