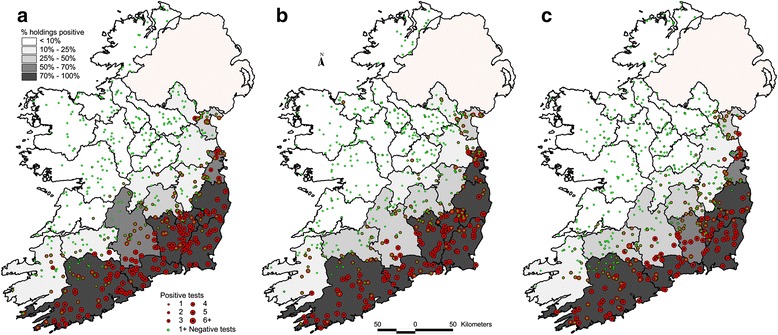
Fig. 3.

County-level herd SBV prevalence, and the spatial distribution of herds positive to SBV, based on active surveillance. The colour and size of each dot refers to the number of animals per farm that were positive to SBV. a During November 2012–January 2013. b During June–August 2013. c During October–November 2013
