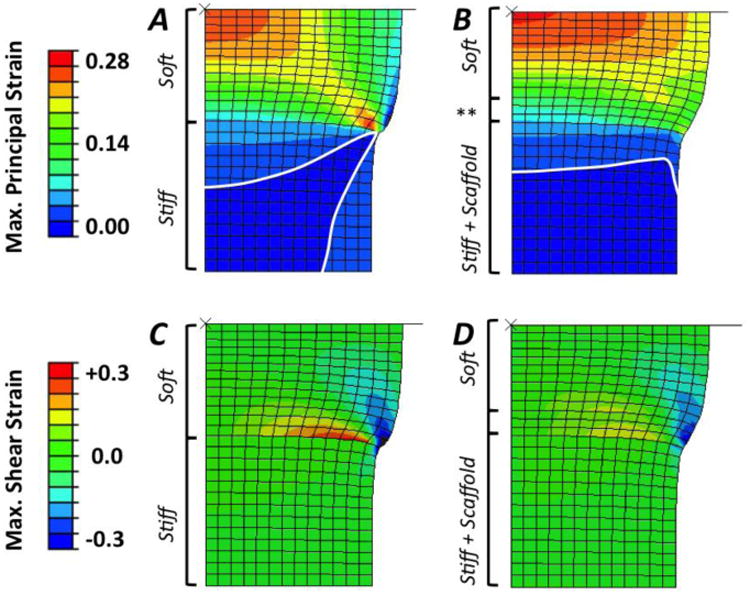
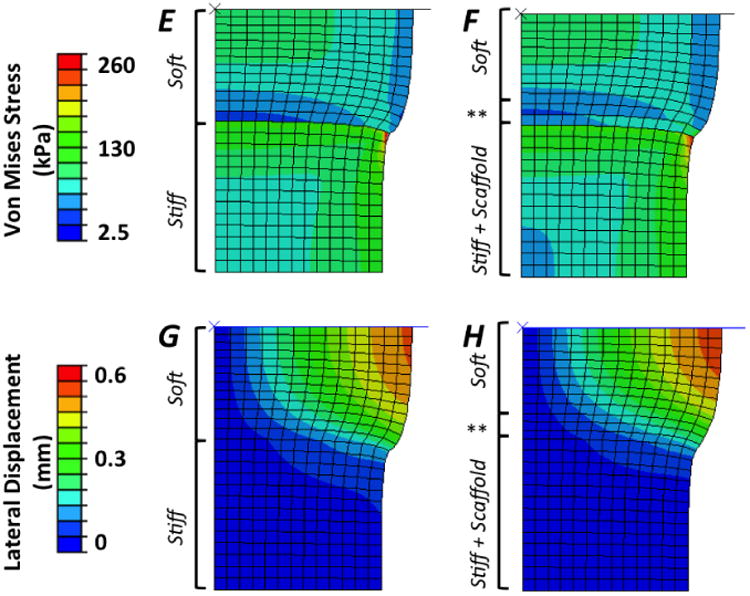
Figure 6.


Comparison of finite element modeling results for single-phase, bi-layer (Left Column) and multi-phase (hydrogel + fibrous scaffold; middle column) PEG hydrogels showing contour plots of (A, B) maximum principal strain (note: stress contour between two lowest strain values are drawn to permit clear visualization), (C, D) maximum shear strain, (E, F) Von Mises stress (kPa), and (G, H) lateral displacement (mm). Finite element modeling shows a 4.2% increase in the compressive modulus of the bi-layered samples with inclusion of the fibrous scaffold throughout the stiff, 30% (w/w) PEG layer and penetrating 500 micrometers into the top, soft 10% (w/w) PEG layer (denoted by **).
