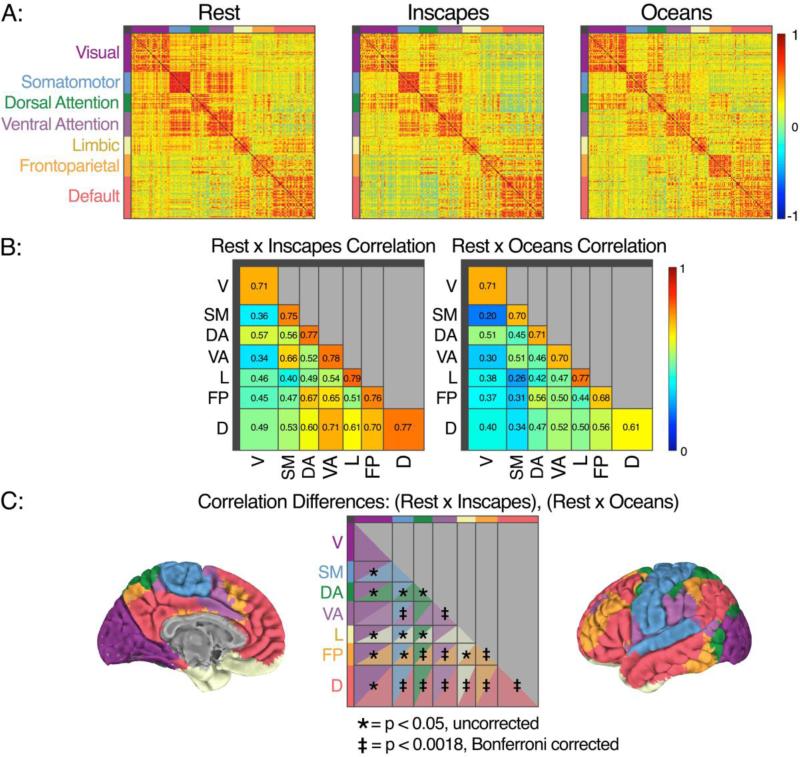
Figure 6. Cross-condition correlations in mean functional connectivity using functional parcellation, healthy adults, n = 22.
Using a parcellation scheme of 200 functional ROIs (Craddock et al. 2012), the time-series of BOLD signal change in each ROI was extracted and Pearson's correlations were computed between all ROI pairs. Correlation coefficients were Fischer z-transformed, averaged across subjects, and reverted to r-values to produce group-level correlation matrices (Row A). For visualization purposes, these ROIs are arranged on the matrix according to network membership using a 7-network system (Yeo et al., 2011, see brain pictures in Row C for anatomical depiction of these networks, and the text at top left to indicate which color denotes which network in Rows A and C). To assess similarity, for each subject and for each of the 28 intra- and internetwork groupings of ROIs, we computed the correlation between conditions (Rest, Inscapes and Rest, Oceans) across ROIs within a grouping. These correlations (reverted r-values as above) are shown in Row B. Both Inscapes and Oceans demonstrate moderate to strong correlations with Rest in multiple groupings. Row C shows the results of a statistical comparison of the subject-level correlations from Row B, which demonstrated that the correlation with Rest is significantly higher for Inscapes than for Oceans for 11 of 28 comparisons when corrected for multiple comparisons. In particular, intra- and inter-network FC for the default network is signficantly more correlated with Rest during Inscapes than during Oceans.

