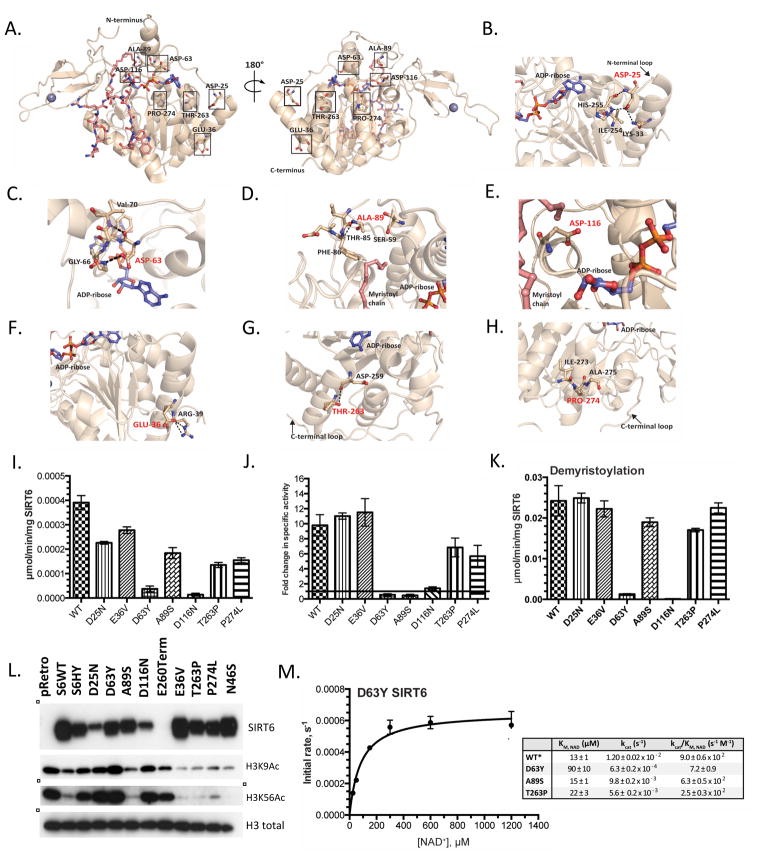
Figure 2. Structural and enzymatic analysis of WT SIRT6 and SIRT6 point mutations.
(A) Locations of mutated residues mapped on the crystal structure of SIRT6 (PDB: 3GZ6). (B–H) Zoomed in view of the mutated residues highlighted in red. Also displayed are residues in close proximity to the mutated residues and hydrogen bonding interactions. (I) SIRT6 deacetylase activity measured in vitro. Recombinant WT and SIRT6 mutants (2 μM) were incubated with 50 μM H3K9Ac peptide and 0.5 mM NAD+. (J) Fold change in SIRT6-dependent deacetylation in the presence of 300 μM myristic acid. (K) SIRT6 demyristoylase activity measured in vitro. WT and SIRT6 mutants (0.5 μM) were incubated with 50 μM H3K9Myr peptide and 0.5 mM NAD+. (I–K n≥3, ± standard deviation) (** = p ≤ 0.01, *** = p ≤ 0.001, ns = p > 0.05) (L) Western blot of chromatin fraction in SIRT6 KO MEFs with doxycycline inducible overexpression of WT SIRT6 and SIRT6 mutants. SIRT6 and H3 total western blots from Fig. 1C are represented here for direct comparison. (M) Steady-state rates of demyristoylation were measured by varying NAD+ (25–1200 μM) in the presence of 0.5 μM D63Y SIRT6 and 50 μM H3K9Myr peptide. Calculated values determined from non-linear regression fits to Michaelis-Menton are shown below for WT, D63Y, A89S, T263P (n≥3, ± standard deviation). *WT SIRT6 values previously published (Feldman et al., 2015).

