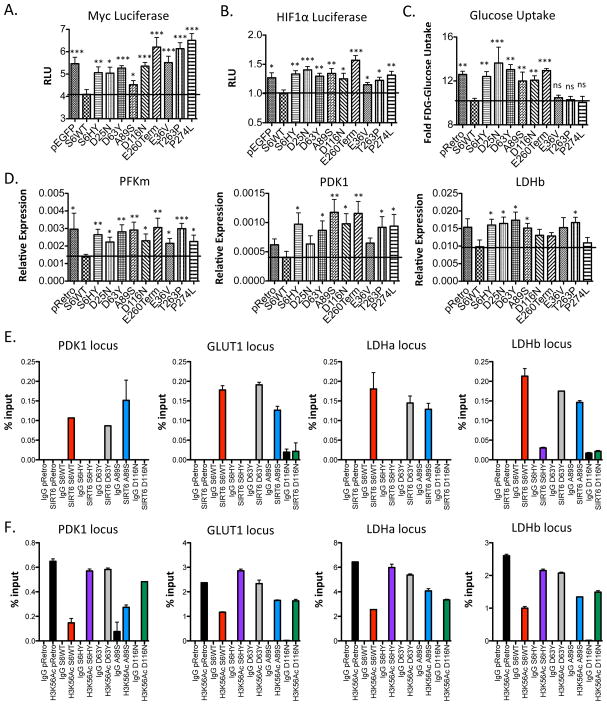
Figure 3. SIRT6 cancer-associated point mutations fail to repress HIF and MYC.
(A & B) Luciferase reporter gene assay for MYC (A) and HIF1α (B) in 293T cells transiently expressing the indicated SIRT6 constructs. Data are shown as mean ± s.e.m. between triplicates and are representative of four independent experiments. (C) NBDG-Glucose uptake in SIRT6 KO MEFs. Data are shown as mean ± s.e.m. between duplicates and are representative of two independent experiments. (D) Quantitative real-time PCR showing the expression of indicated genes. Data are shown as mean ± s.e.m. between duplicates in six independent experiments. (E&F) Chromatin immunoprecipitation for SIRT6 (E) and H3K56Ac (F) in SIRT6 KO MEFs expressing the indicated SIRT6 constructs followed by quantitative PCR amplification of the indicated glycolytic genes. Data are shown as mean ± s.e.m. between duplicates. *= p ≤ 0.05, ** = p ≤ 0.01, *** = p ≤ 0.001.

