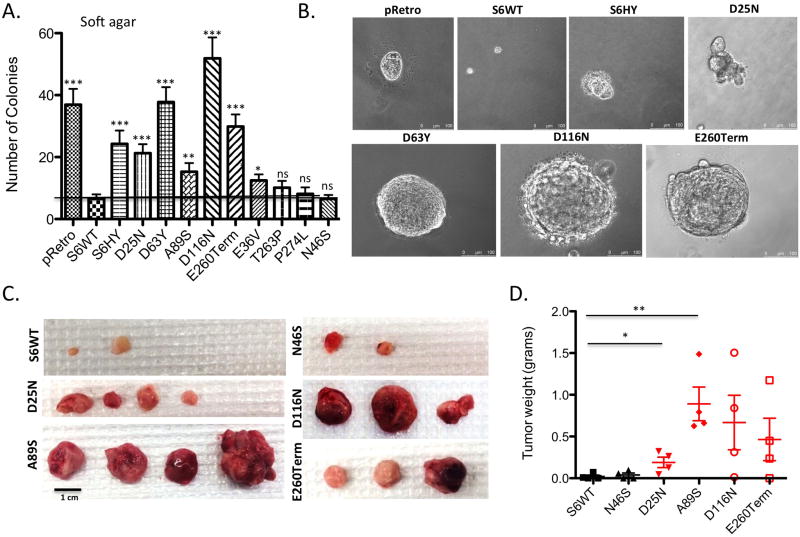
Figure 4. SIRT6 cancer-associated point mutations fail to repress anchorage independent growth.
(A) Quantification of colonies grown in soft agar of SIRT6 KO MEFs expressing each mutant. Data are shown as mean ± s.e.m. between triplicates in four independent experiments. (B) Representative pictomicrographs of colonies. (C) Gross images of subcutaneous tumors grown in SCID mice of SIRT6 KO cells re-expressing the indicated SIRT6 constructs (n=5) (D) Quantification of tumor weight from (C). *= p ≤ 0.05, ** = p ≤ 0.01, *** = p ≤ 0.001.

