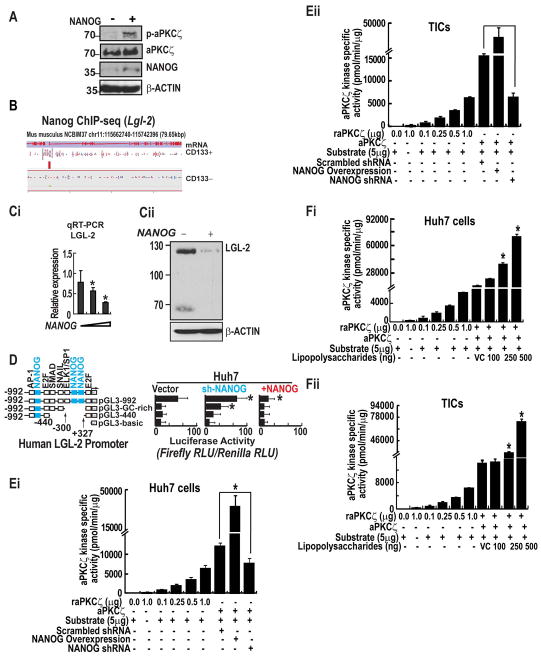
Figure 2. NANOG modulates LGL2 and aPKCζ, a NUMB kinase, expression and activity.
(A) NANOG overexpression promotes phosphorylation of aPKCζ. (B) Read density for NANOG ChIP-seq libraries at the Lgl-2 locus in CD133+ TICs and CD133− controls. A red bar representing a significantly enriched NANOG binding site detected at the Lgl-2 locus is shown. Representations of the annotated mRNA and coding sequencing (CDS) for Lgl-2 are shown at the top. (Ci) NANOG represses LGL-2 expression as measured by qRT-PCR. Error bars represent the SD from at least three independent biological replicates (*P < 0.05). (Cii) NANOG inhibits expression levels of LGL-2 protein. (D) Silencing of NANOG transcriptionally activates LGL-2 promoter. Huh7 cells stably overexpressing NANOG or scrambled shRNA, or sh-NANOG were transduced with the LGL-2 promoter sequences placed upstream of a firefly luciferase reporter gene. Promoter activity is displayed as relative light units (RLU) normalized to the activity of cotransfected Renilla luciferase. Error bars represent the SD from at least three independent biological replicates (**P < 0.05). (Ei–ii) The histogram represents the effect of NANOG-silenced and -overexpression of the kinase activity of aPKCζ in Huh7 cells (Ei) and TICs (Eii). (Fi–ii) The histogram represents the effect of Lipopolysaccharides on aPKCζ kinase activity Huh7 cells (Fi) and TICs (Fii). Each bar in the histogram represents mean ± SD of three independent experiments, * represents P < 0.05.

