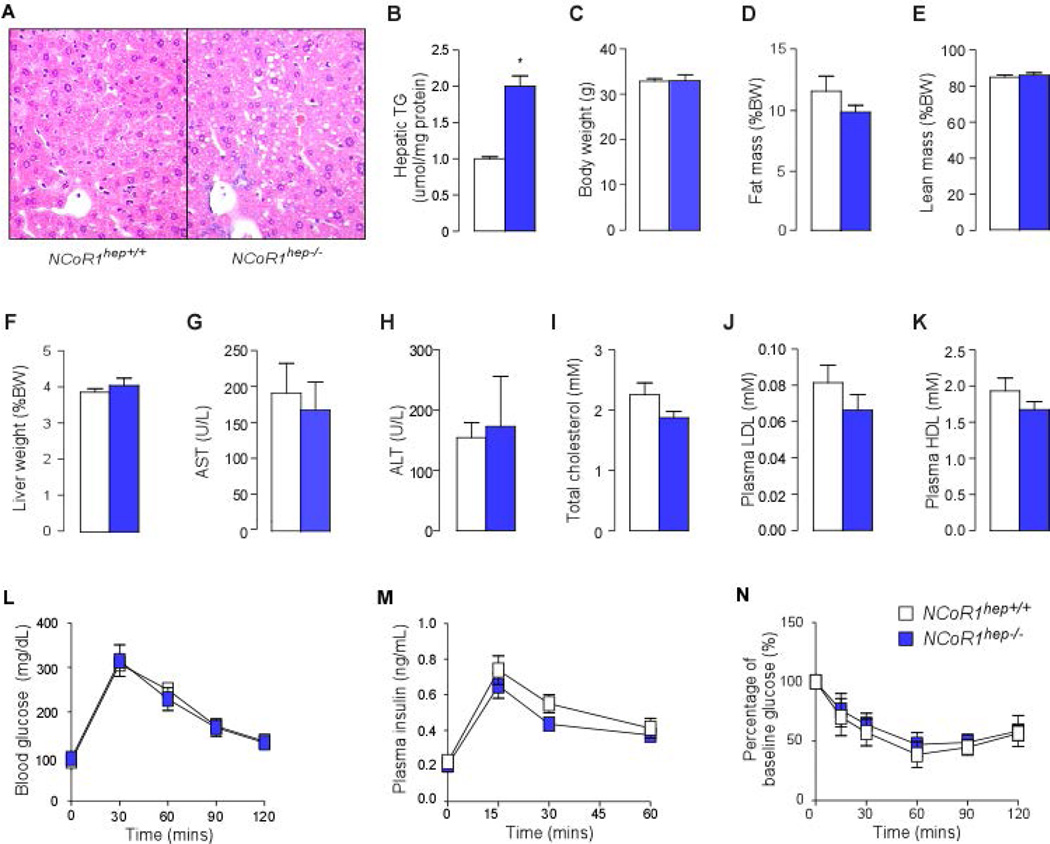
Figure 5. NCoR1hep−/− mice have hepatic lipid accumulation.
(A) Hematoxylin and eosin staining of liver sections from 25-wk old male chow fed NCoR1hep+/+ and NCoR1hep−/− mice that were fasted for 4-hr. (B) Hepatic triglyceride measurements in livers from 25-wk old male chow fed NCoR1hep+/+ and NCoR1hep−/− mice that were fasted for 4-hr (n = 7/group). Anthropometric (C–F) and biochemical analysis (G–K) of NCoR1hep−/− mice compared to NCoR1hep+/+ mice. (L and M) Blood glucose and insulin levels before and during intraperitoneal glucose tolerance test (ipGTT) in 25-wk old chow fed male NCoR1hep+/+ and NCoR1hep−/− mice after a 4-hr fast (n > 7/group). (N) Percentage of baseline glucose levels during Insulin tolerance test (ITT) in 25-wk old chow fed male NCoR1hep+/+ and NCoR1hep−/− mice after overnight fasting (n > 7/group). All data shown as mean ± SEM, * p < 0.05, ** p < 0.01, *** p < 0.001.

