Table 3.
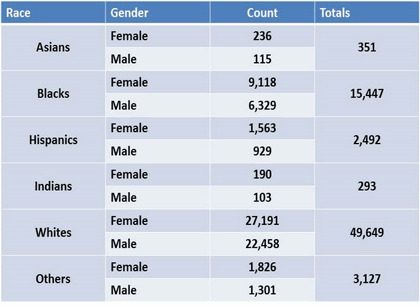
Race-gender distribution of post-exclusion population
| (a) Patient counts with various ethnic backgrounds listed. Gender differences are included. |
 |
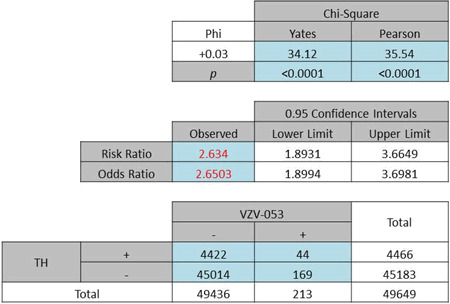
| (b) Odds ratio of total Caucasians: 2·65, P < 0·0001 |
 |
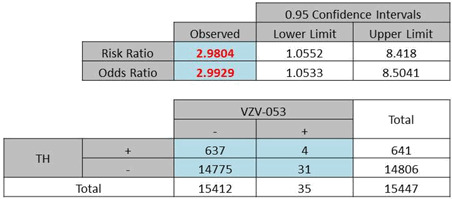
| (c) Odds ratio of total African Americans: 2·99, P = 0·082 (Yates) or 0·031 (Pearson) |
 |
 |
