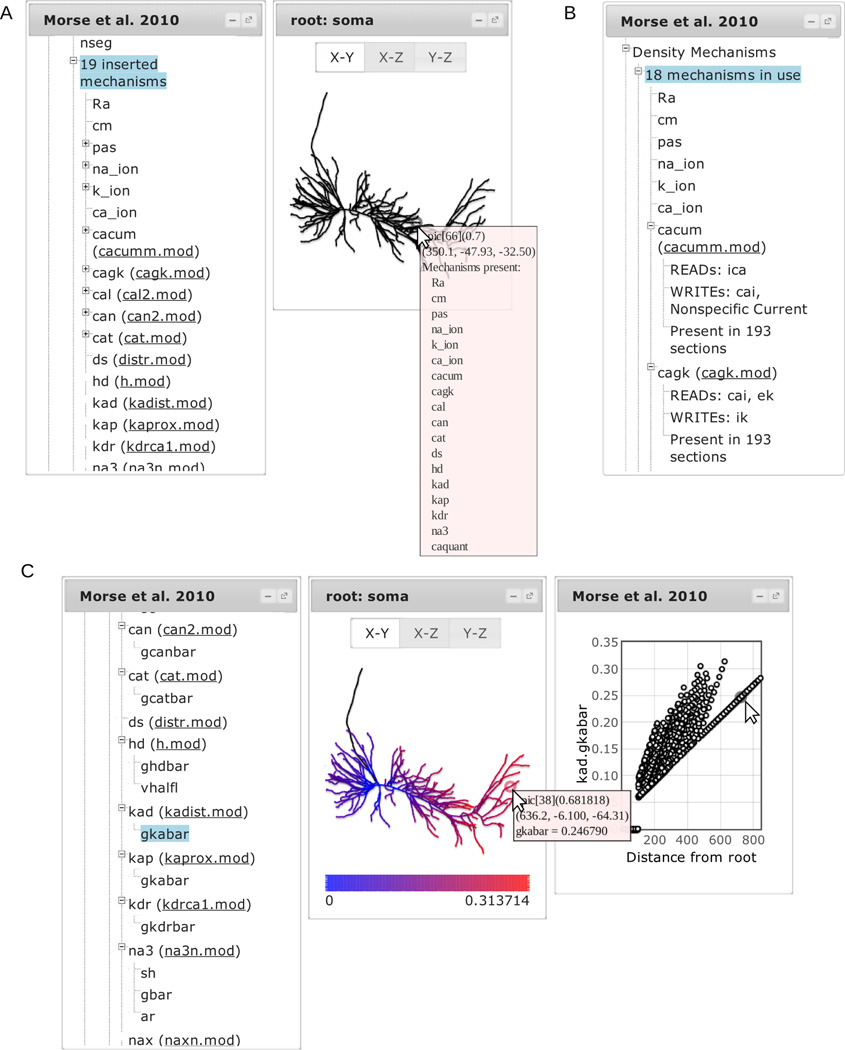
Figure 4.
Exploring mechanisms. (A) Selecting a cell and then selecting inserted mechanisms lists all the mechanisms present within the cell. Mousing over the cell displays a popup listing the mechanisms that are located in the corresponding segment. (C) Selecting a mechanism displays its associated range variables; selecting a variable displays its values on the plots. (B) Selecting “Density Mechanisms” instead of a single cell lists all the density mechanisms in the model; selecting one shows what ionic states it reads or writes.

