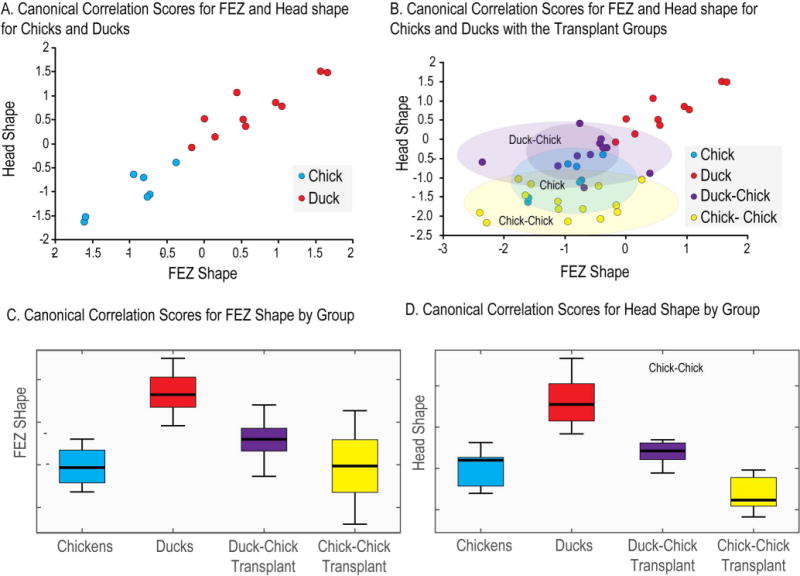
Figure 1. 3D Morphometric analysis of FEZ and craniofacial shape based on optical projection tomography imaging.

(A) Canonical correlation scores for chick and duck embryos for FEZ and Head shape. This plot shows the clear separation of FEZ and head shape in duck and chick embryos, as well as the correlation between Shh expression in the FEZ and facial shape. (B) Here the two hemi-forebrain transplant groups (duck to chick and chick to chick) are added to the data shown in graph A. Morphometric analysis for the transplants is performed only on the transplant side. The clear separation of facial shape among these groups is shown with the duck-chick transplant group shifted significantly towards the duck group. (C) and (D) show the means and dispersions of the canonical correlation scores for FEZ and head shape.
