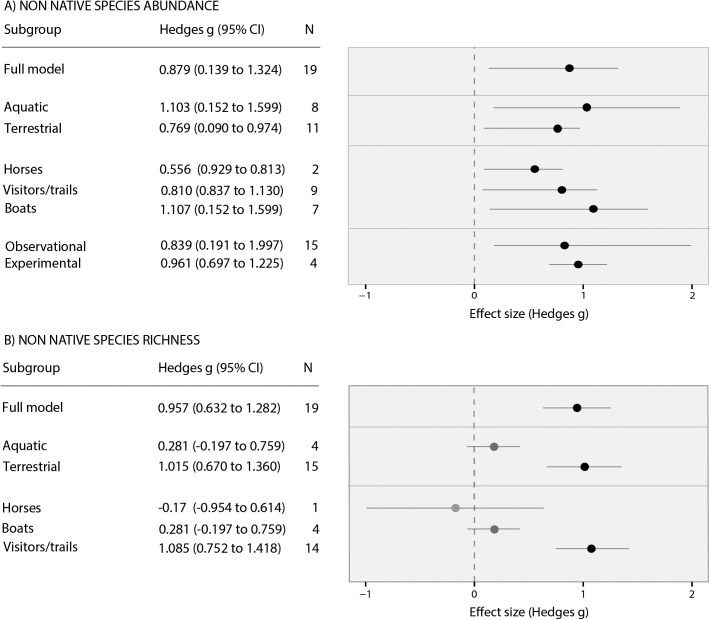
Fig 2. Meta-analysis forest plots.
Plots show the effect of recreational activities on A) non-native species abundance and B) non-native species richness. Effect size values >0 show that the species richness or abundance of non-native species was greater in sites where recreational activities took place. The mean effect size and 95% confidence interval is shown for the overall result and each sub-group analysis. Bias-corrected confidence intervals were bootstrapped for groups n<10 and parametric confidence intervals for groups n≥10. Confidence intervals that overlap the dashed line at zero are not significantly different from zero.

