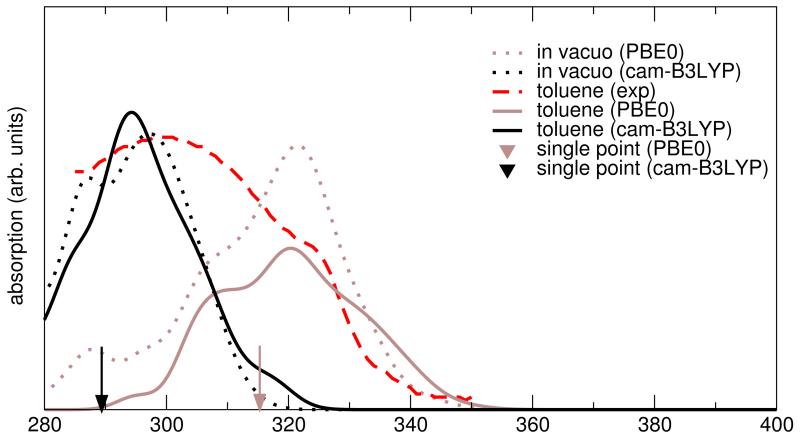
Figure 8.
Absorption spectra in vacuo (dotted) and in toluene solution (solid line) calculated with different DFT XC functionals (PBE0: brown, CAM-B3LYP: black) in the statistical approach, compared to the static approach (placemarks) and to the experimental spectrum. The same normalization was used for all the computed spectra.

