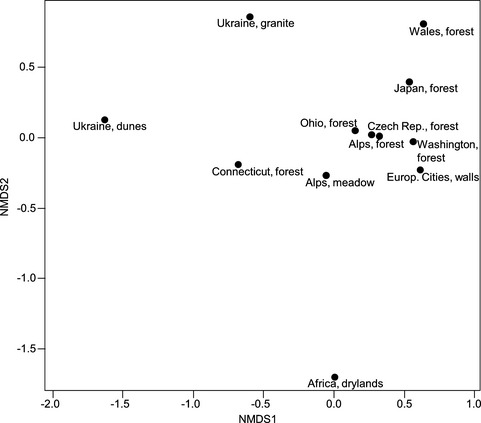
Figure 9.

nMDS plot based on Bray–Curtis dissimilarity index visualizes differences in composition of Klebsormidium clades, based on absolute numbers in alpine region and other terrestrial habitats. For explanation of symbols, see legend of Figure 8; stress = 0.06.
