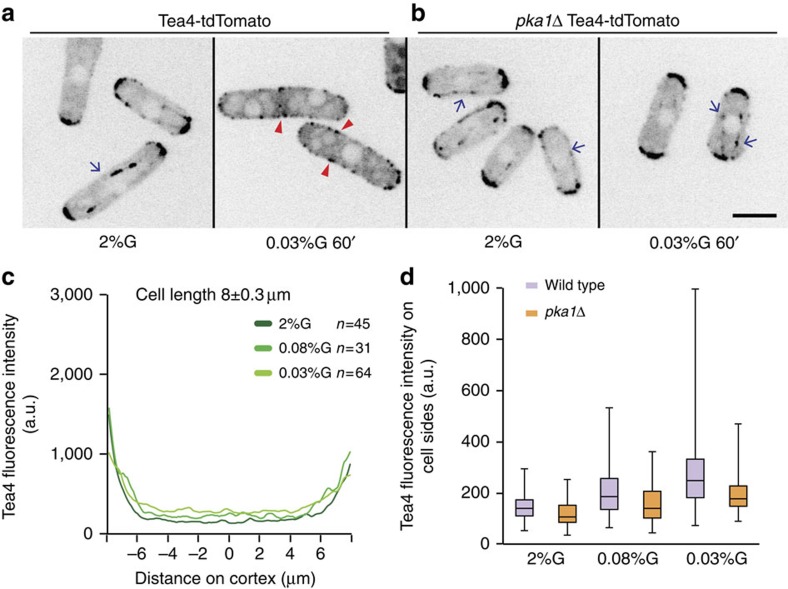
Figure 3. Pka1-dependent reversible Tea4 re-localization around the cell cortex upon glucose limitation.
(a) Sum of five medial spinning disk confocal images taken over 30 s of Tea4-tdTomato in wild-type cells grown in 2% glucose or 0.03% glucose for 1 h. Arrows indicate Tea4 tracks on microtubules. Arrowheads indicate Tea4 dots at cell sides. (b) Localization of Tea4-tdTomato in pka1Δ cells as in a. (c) Distribution of cortical Tea4 from one tip to the other (0=cell middle) in wild-type cells obtained with the Cellophane plugin. Average of 45, 31 and 64 profiles in 2, 0.08 and 0.03% glucose in 8-μm-long cells. Profiles obtained from other cell lengths are similar. (d) Box and whisker plot of cortical Tea4 fluorescence intensity in the middle 2 μm region in both wild type (n=45, 31 and 64) and pka1Δ cells (n=71, 66 and 62) in 2%, 0.08% and 0.03% glucose, respectively. Scale bars represent 5 μm. Experiments were performed thrice and quantification of one is shown.

