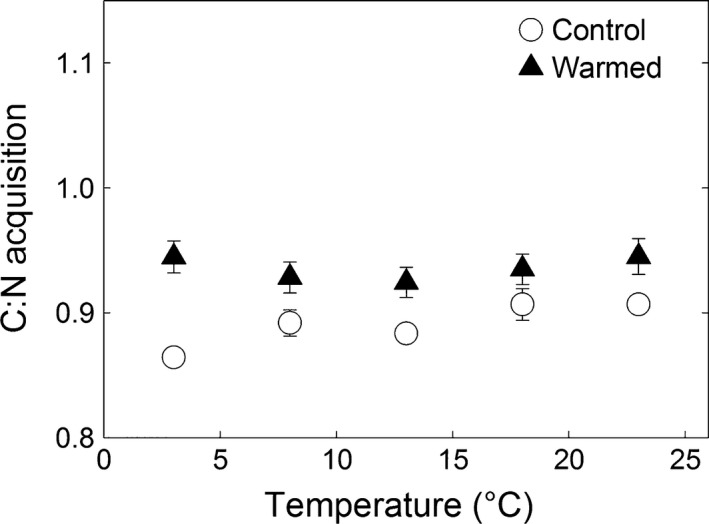
Figure 4.

Ratio of enzymatic C : N acquisition, calculated as the sum of the log‐transformed activities of beta‐glucosidase and cellobiohydrolase activity over the sum the log‐ transformed activities of N‐acetyl‐glucosaminidase and leucine aminopeptidase activity at different incubation temperatures. Full triangles represent the values for soil which was exposed to 9 years of warming (means ± SE, n = 3). Open circles represent the values for soil which had experienced the corresponding natural temperature conditions (means ± SE, n = 3).
