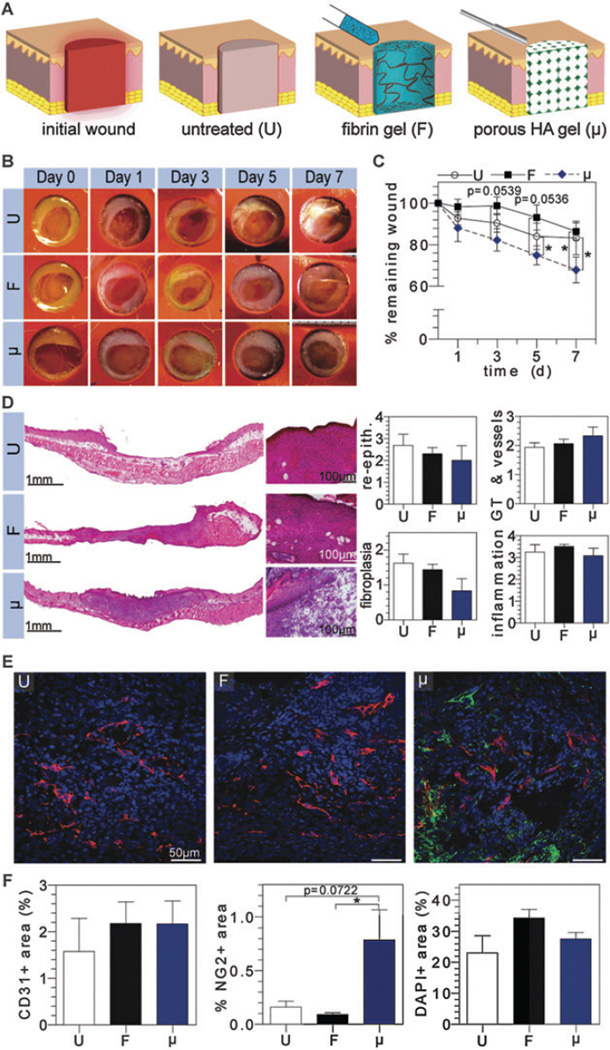
Fig. 1.
Evaluation of solely conductive natural scaffolds in vivo. (A) Schematic representation of untreated (U), fibrin (F), and microporous HA (μ) filled wounds following initial wound creation. Digital images of wounds were taken at regular time intervals for wound closure analysis (B and C). H&E stained wounds depict granulation tissue formation and were scored by a pathologist for re-epithelialization, granulation tissue/vessel formation, fibroplasias, and inflammation (D). OCT embedded sections were stained for vascular cell populations (E), where CD31+, NG2+, and nuclei imaged in red, green, and blue, respectively, and quantified via imageJ (F).

