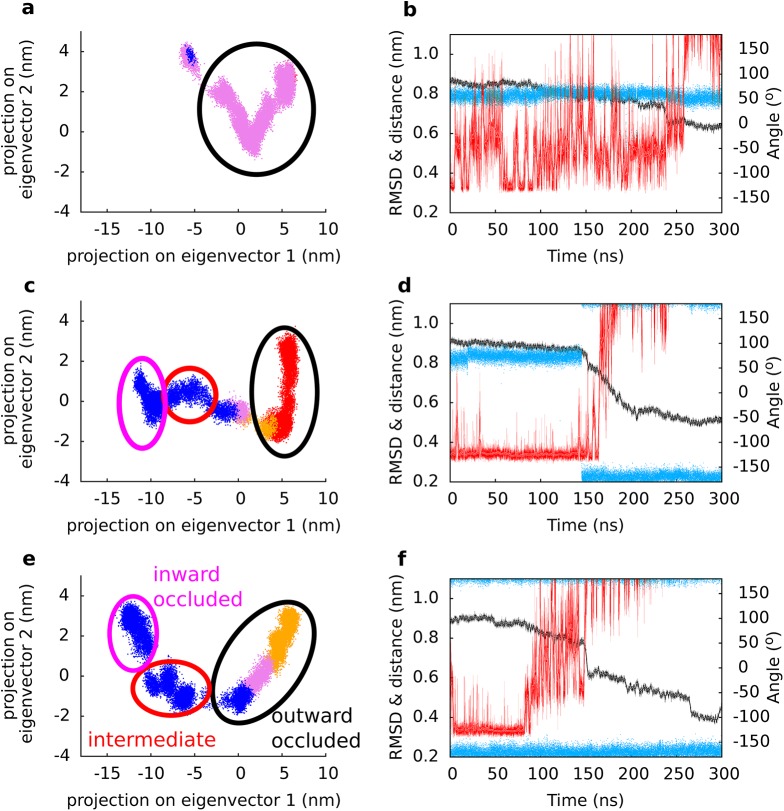
Fig 8. Correlation analysis.
Panel (a, c, e) show movements of a GltPh protomer along the two largest eigenvectors (translation and rotation of the domains relative to each other) observed in the simulations of protomer A, B and C, respectively. Each dot represents the projection of one frame in the trajectory onto the 2 dimension of eigenvectors 1 (translation) and 2 (rotation). Four distinct periods of the trajectory are color coded: The first part of the trajectory (red) represents the outward-occluded state. A shift to orange marked the rotation of T308. Rotation of side chain of Y195 notifies the transition to the third period (pink). The fourth region shown in blue represents the period after opening of the intracellular interaction network. The intermediate state is reached in the populated region in the middle of the plot, after opening of the intracellular interaction network. Panel (b, d, f) show an overlay of the time evolution of the RMSD (black), the rotational state of the side chain of T308 (blue) and the side chain–side chain distance between E192 and K290 (red) of protomer A, B and C, respectively.

