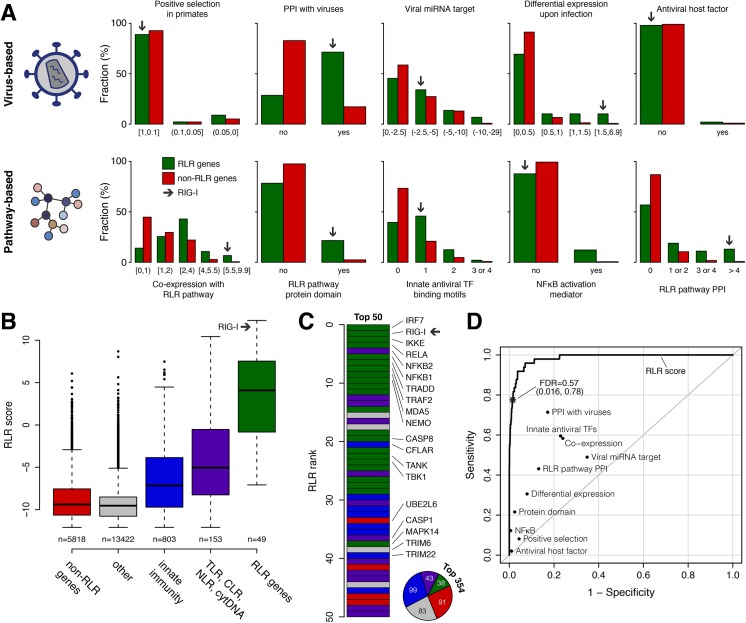
Fig 1. Bayesian integration of ten molecular signatures of RLR pathway components from genomics data.
(A) Distributions of the 49 known RLR pathway components (RLR genes, green) and 5,818 genes unlikely to be part of the pathway (non-RLR genes, red) across the 10 molecular signature data sets we identified as predictive of the RLR system (see also Table 1). Data sets were binned into discrete intervals and fractions of (non-)RLR genes add up to one. Arrows indicate the behavior of RIG-I across the data. The top five signatures describe the relationship of RLR signaling with viruses; the bottom five describe properties of the pathway itself. (B) Boxplots of the genome-wide integrated RLR score (Bayesian posterior probability score). Genes were grouped into one of five classes: known RLR genes (green, see [A]), components of other PRR signaling pathways (‘TLR, CLR, NLR, cytDNA’; purple), genes functioning in other aspects of the innate immune response (‘innate immunity’; blue), and non-RLR genes (red, see [A]). The remaining genes are classified as ‘other’ (gray). (C) The 50 genes with the highest RLR scores. Representative RLR and other innate antiviral response genes are indicated. The pie chart shows the occurrences of the different gene classes in the top 354 RLR ranks. (D) Receiver operating characteristic (ROC) curve illustrating the performance of the integrated RLR score (solid black line) and the individual molecular signatures (black dots) for predicting known RLR versus non-RLR genes. Sensitivity and specificity were calculated at various score thresholds (for the RLR score), or at specific thresholds that include all bins with positive likelihood ratio scores (for the individual data sets; see (A)). The asterisk denotes the sensitivity and specificity corresponding to a false discovery rate (FDR) of 57% (top 354 genes). Note that, to avoid circularity, the predictive ability of the co-expression, protein domain and RLR pathway PPI data sets in (A) and (D) was assessed using the set of TLR, CLR, NLR, cytDNA genes instead of the RLR genes (see Methods).

