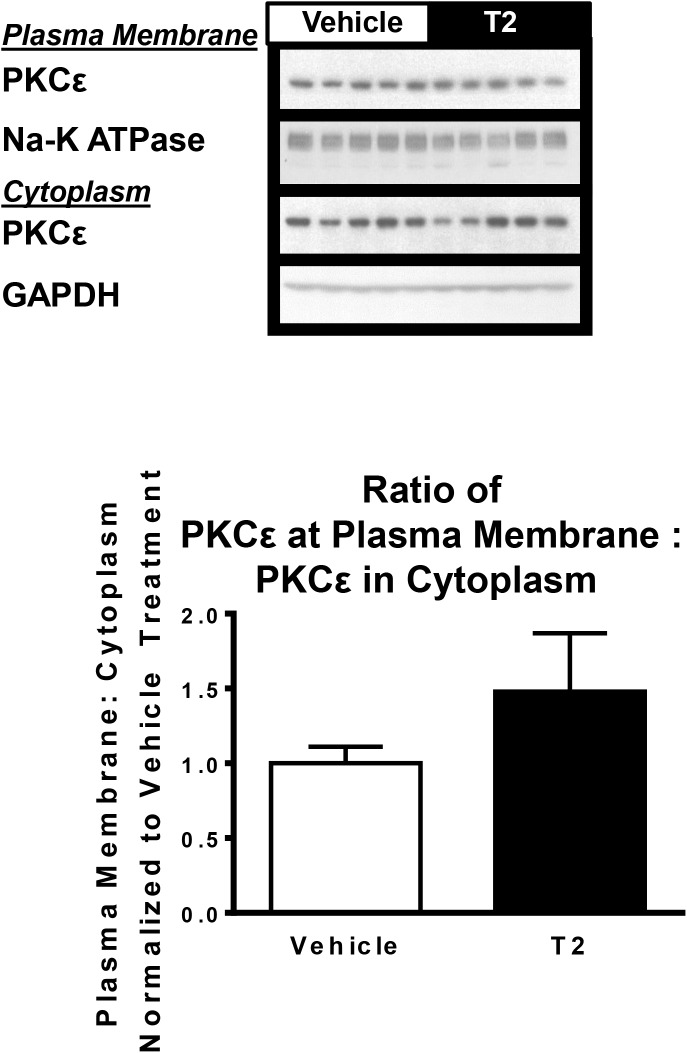
Fig 3. Hepatic PKCε translocation between cytoplasm and plasma membrane.
Assessed by Western blot. Plasma membrane PKCε abundance normalized to sodium potassium ATPase, cytoplasmic PKCε abundance normalized to glyceraldehyde 3 phosphate dehydrogenase (GAPDH). Ratio between plasma membrane and cytoplasm PKCε was determined for all samples, this ratio for all samples was normalized to the average ratio in the vehicle treated group. (n = 5 per group).

