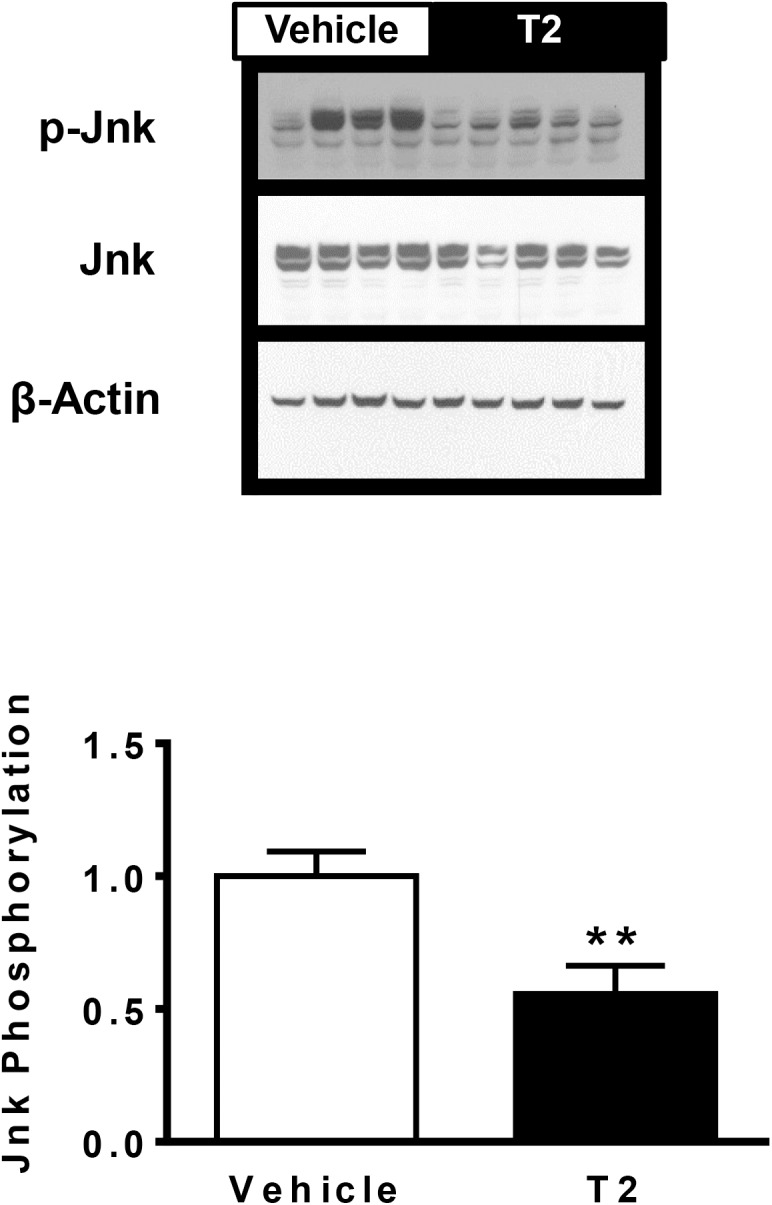
Fig 4. Hepatic c-Jun N-terminal kinase (JNK) phosphorylation assessed by Western blot.

Representative immunoblots displayed. Data quantitated as ratio of phosphorylated JNK to total JNK abundance, normalized to vehicle treatment. (** P < 0.01; Vehicle treatment: n = 8; T2 treatment: n = 9).
