
Fig. 7.
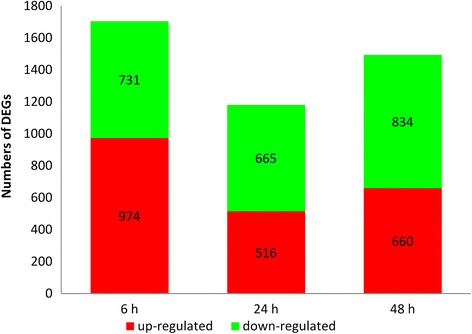
DEG transcriptome profiles of Urechis unicinctus exposed to 50 μM sulfide for different periods. The values in the red and green regions represent the number of up-regulated and down-regulated DEGs, respectively
Official websites use .gov
A
.gov website belongs to an official
government organization in the United States.
Secure .gov websites use HTTPS
A lock (
) or https:// means you've safely
connected to the .gov website. Share sensitive
information only on official, secure websites.
DEG transcriptome profiles of Urechis unicinctus exposed to 50 μM sulfide for different periods. The values in the red and green regions represent the number of up-regulated and down-regulated DEGs, respectively