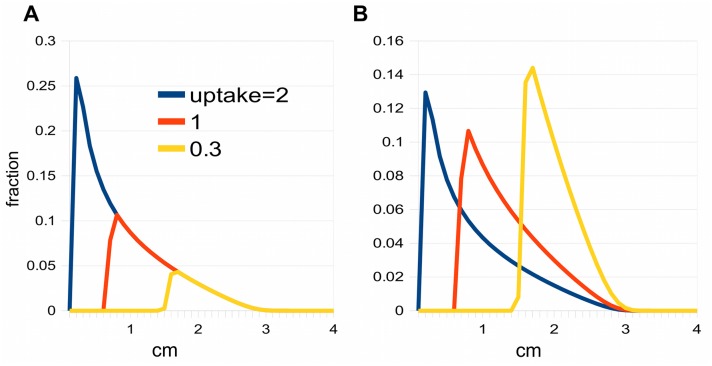
Fig 4. Effect of saturation on pulses.
A: The three pulses have run for the same length of time. The auxin distributions have not been normalised so that the lining up of their fast fronts is apparent. The uptake is the total amount of auxin, i.e. the area under the graph. B: Same as A, but the distributions have been normalised to emphasize the peaks.

