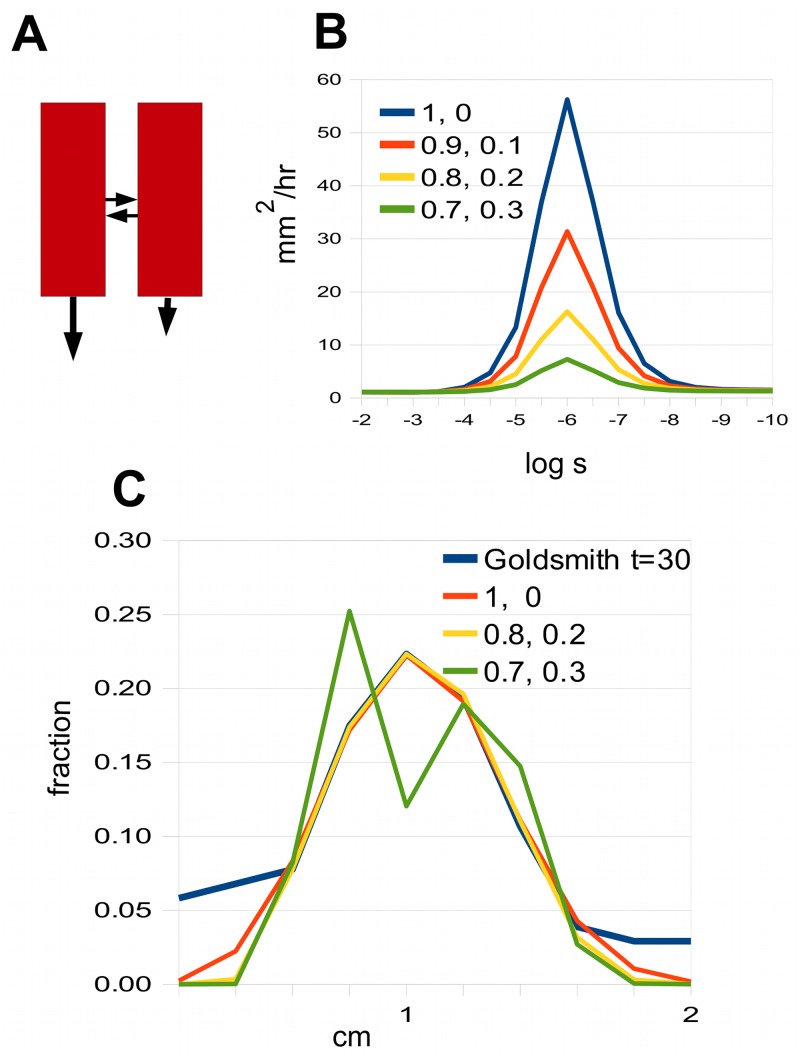
Fig 7. Spreading rates for modified version of the minimal model.
A: The two channels are both polar but with different degrees of polarity (different sized vertical arrows). B: The spreading rate for some values of the ratio of the polarities of the channels. C: Best fits to Goldsmith’s 30 minute data for different polarity ratios, showing that how it fails when the polarity ratio falls to 0.7:0.3. The curve labelled “Goldsmith” is based on data in Fig 1D in [13].

