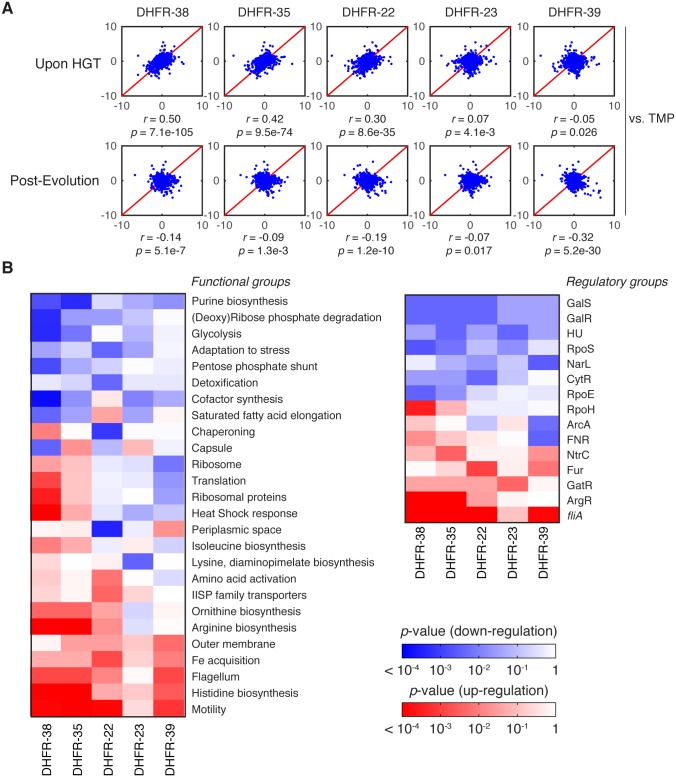
Fig 7. Global proteomic response to HGT.
A) z-scores correlation plots between proteomes of indicated DHFR orthologous strains (upon HGT and after evolution) and WT strain treated with 1 μg/ml trimethoprim (TMP) (see Materials and Methods and S6 Table). The strains are representative of the fitness effects upon HGT: DHFR-23, 35 and 38 are severely deleterious; DHFR-22 is mildly deleterious; and DHFR-39 is beneficial (Fig 1C). Global proteome quantification was obtained using LC-MS/MS analysis of TMT-labeled proteomes [34]. Each quantified protein (+2,000 proteins per proteome) is assigned a z-score that measures the enrichment of its abundance relative to the whole proteome (see Materials and Methods). The proteome profile upon HGT of DHFR-38, 35 and 22 is similar to the adverse cellular state during the antibiotic treatment, but is relaxed after experimental evolution. The strains are ordered left to right according to decreasing similarity with TMP treated WT cells (top panel). B) Change in global variation in protein abundances induced by experimental evolution of the indicated orthologous strains calculated for functional and regulatory classes of genes. Color code indicates logarithm of p-values of two-sample KS tests performed on pre- and post-evolution proteomes along with the direction of change (blue—drop in abundance, red—increase in abundance) (see Materials and Methods). We plotted only the gene groups whose change upon evolution experiment is significant (KS p value less than 0.01). The proteomic responses DHFR-35 and 38 upon HGT and post-evolution are similar despite their evolutionary distance (see Fig 1C).

