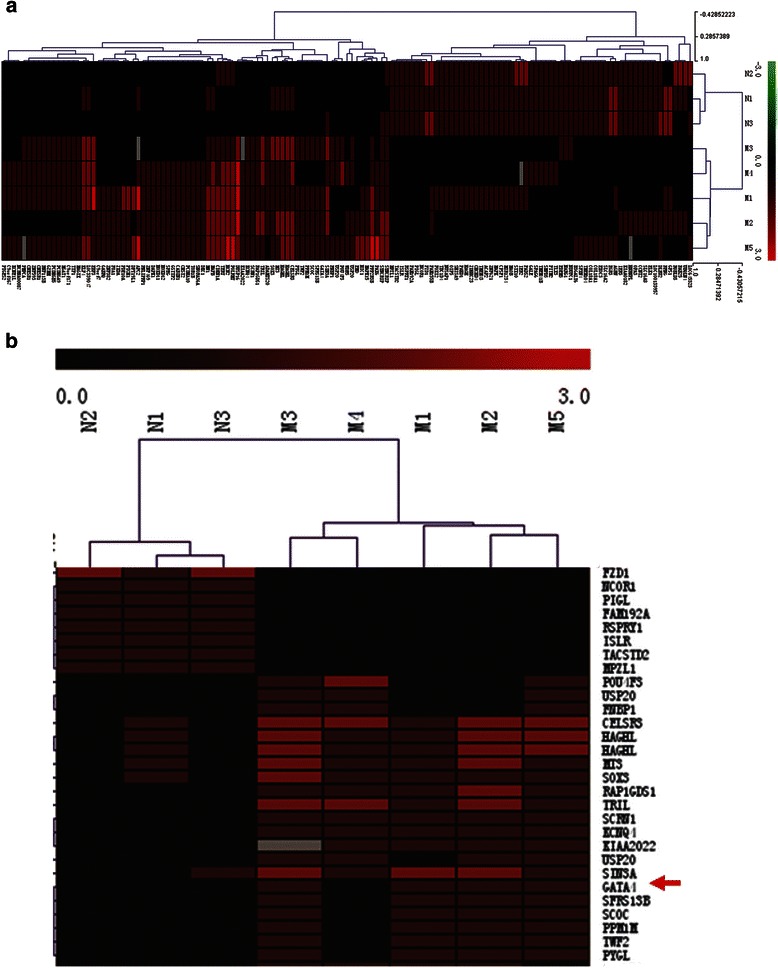
Fig. 1.

Promoter methylation analysis of pediatric AML with NimbleGen Human DNA Methylation Arrays. a Analysis of the methylation status of genes in four pediatric AML samples (M1, M2, M3, M4 and M5) and three NBM samples (N1, N2, and N3) using NimbleGen Human DNA Methylation Arrays. Each red box represents the number of methylation peaks (PeakScore) overlapping the promoter region for the corresponding miRNA. The PeakScore is defined as the average -log10 (P-value) from probes within the peak. The scores reflect the probability of positive methylation enrichment. b DNA methylation array analysis showing significant methylation of the GATA4 promoter in AML samples (4/5), and unmethylated in NBM samples (0/3)
