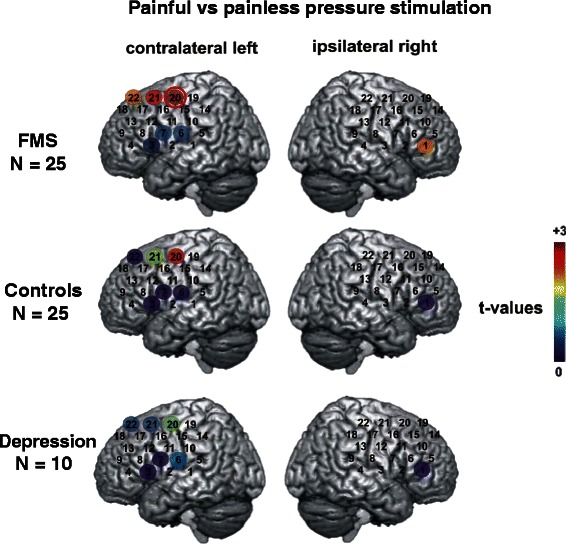
Fig. 1.

Cerebral activity in fNIRS recordings after painful versus painless pressure stimulation. Coloured circles present the results of t-tests comparing the beta weights between two conditions (painful versus painless stimulation) for each of the three study groups for significant channels. Each circle shows the t-value of the comparison in each channel (indicated by the colour bar, where dark red represents the largest t-value [+3] and dark blue the smallest t-value [0]). Data from the contralateral hemisphere are presented in the left column while those from the ipsilateral hemisphere are presented in the right column. The channel marked with a red circle withstands the DAP correction for multiple testing (left side r59 = 0.441, critical t-value (two-sided) = 2.69, α = 0.009; right side r59 = 0.455, critical t-value (two-sided) =2.67, α = 0.01)
