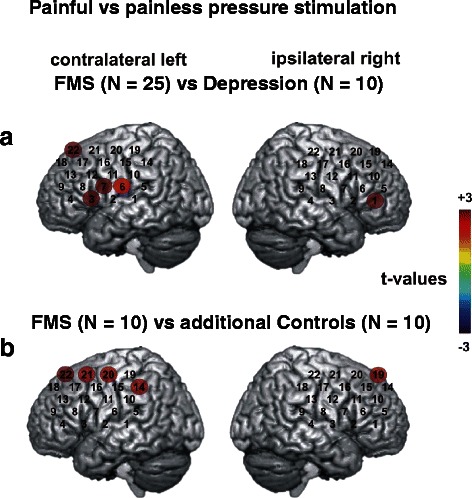
Fig. 2.

Cerebral activity in fNIRS recordings after painful pressure stimulation comparing FMS patients with patients with depression and with healthy controls. a Coloured circles present the results of DAP corrected post-hoc t-tests comparing the beta weights between two conditions (painful versus painless stimulation) for the comparisons between patients with fibromyalgia syndrome (FMS) and depression (left side r59 = .441, critical t-value (two-sided) =2.69, α = 0.009; right side r59 = 0.455, critical t-value (two-sided) = 2.67, α = 0.01). Each circle shows the t-value of the respective comparison in each channel (indicated by the colour bar, where dark red represents the largest t-value [+3] and dark blue the smallest t-value [−3]). Data from the contralateral hemisphere are presented on the left side while those from the ipsilateral hemisphere are presented on the right side. Painful pressure stimulation leads to a much stronger cerebral activation in FMS patients than in patients with depression. b Coloured circles present the results of DAP corrected post-hoc t-tests comparing the beta weights between two conditions (stimulation with a pressure intensity just at the pain threshold of FMS patients, i.e. painless for healthy controls) for the comparisons between patients with fibromyalgia syndrome (FMS) and healthy controls for significant channels (left side r59 = 0.441, critical t-value (two-sided) = 2.69, α = 0.009; right side r59 = 0.455, critical t-value (two-sided) = 2.67, α = 0.01). Each circle shows the t-value of the respective comparison in each channel (indicated by the colour bar, where dark red represents the largest t-value [+3] and dark blue the smallest t-value [−3]). Data from the contralateral hemisphere are presented on the left side while those from the ipsilateral hemisphere are presented on the right side. The stimulation leads to a bilateral cerebral activation only in FMS patients
