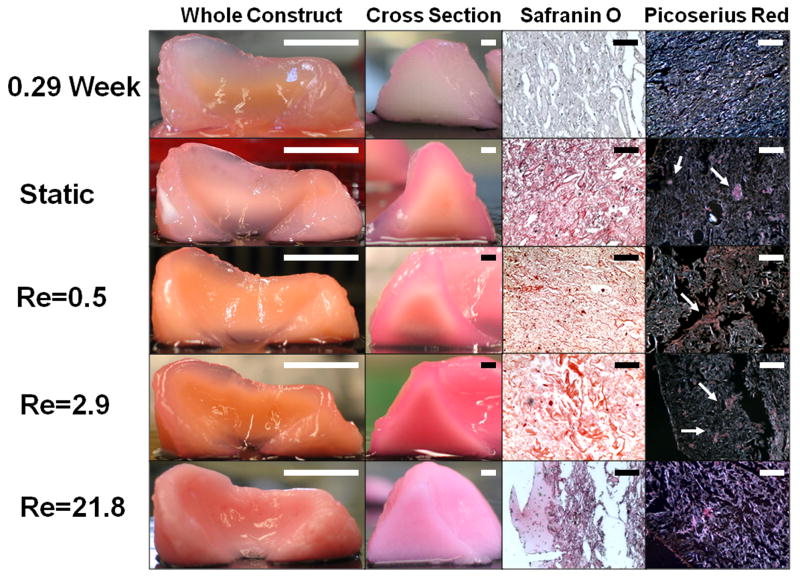
Figure 3.
Photographs of (column 1) intact implants, (column 2) cross-sectional views, (column 3) tissue sections stained with Safranin-O at 200× original magnification and (column 4) tissue sections stained with picrosirius red at 200× original magnification for engineered cartilage at 0.29 weeks and 6 weeks for static and mixing intensities of Re 0.5, Re 2.9, Re 21.8. Scale bars represent (column 1) 10mm, (column 2) 2mm, and (column 3&4) 100 μm. Arrows point to collagen fiber bundles.

