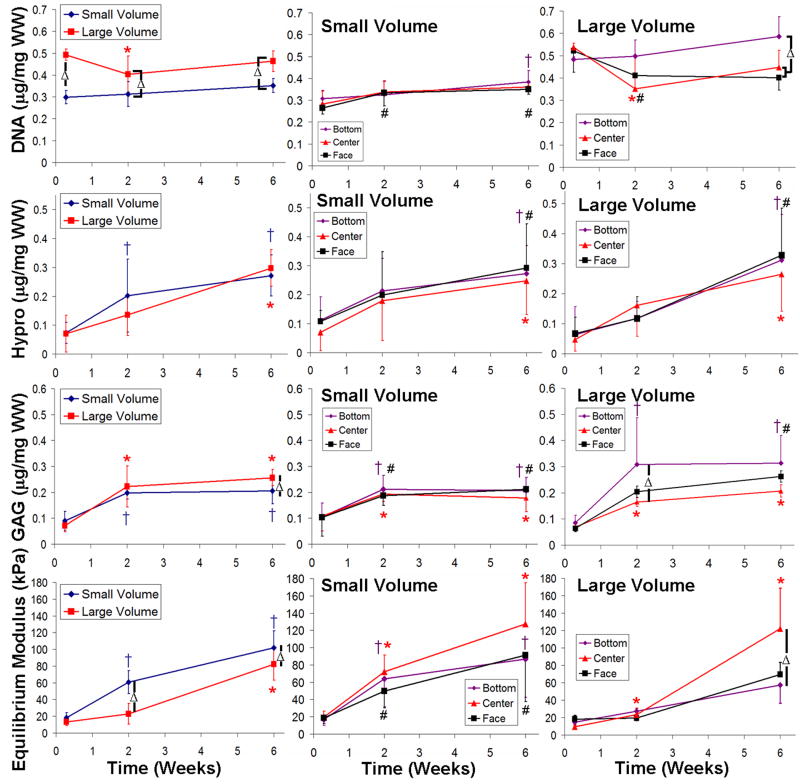
Figure 4.
Plots of DNA content (row 1), collagen content (row 2), GAG content (row 3), and compressive modulus (row 4) comparing large and small volume constructs (column 1) and looking at the individual spatial properties for each volume size (column 2&3 respectively). For column 1 a “ ” denotes significant differences with respect to 0.29 weeks culture time in large volume constructs, a “
 ” denotes difference in small volume constructs, and a “Δ” denotes differences between small and large volume constructs. For columns 2 and 3 a “
 ” denotes significant differences with respect to 0.29 weeks culture time in the bottom location, a “
 ” denotes differences in the center location, a “#” denotes differences in the face locations with time, and a “Δ” denotes differences between bottom, center, or face locations for a given time point. Data represented as mean ±SD and P < 0.05.

