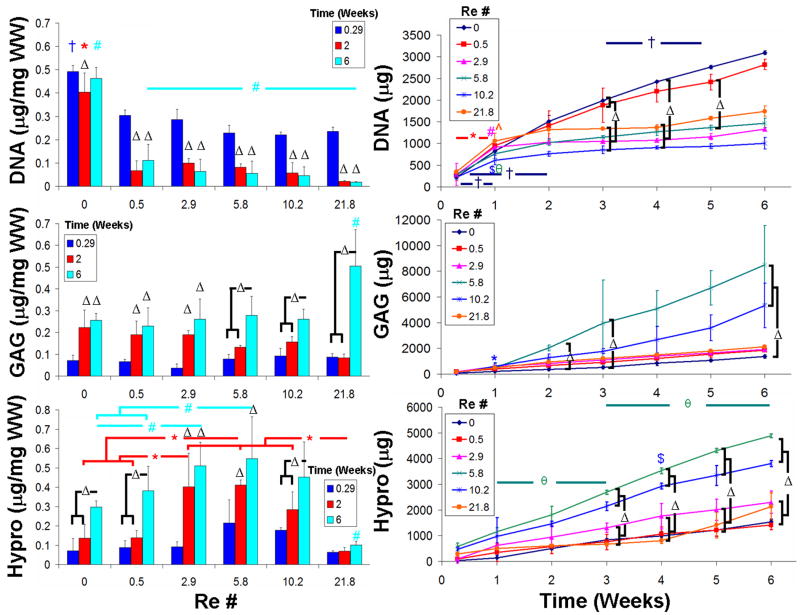
Figure 5.
DNA content, GAG content, and collagen content found in engineered constructs (column 1) and cumulative release to the culture medium (column 2) for different mixing intensities. For column 1 a “Δ” denotes a significant difference with respect to 0.29 weeks cultures unless otherwise specified within a given mixing intensity, a “ ” denotes significant differences compared to all other 0.29 weeks values of different mixing intensities unless otherwise specified, a “
 ” denotes a difference compares to all other 2 weeks values, and a “
 ” denotes a difference compared to all other 6 weeks values. In column 2 a “Δ” denotes a significant difference between media values for that given time point, and the remainder denote differences between respective time points for a given mixing intensity: “
 ” = static, “
 ” = Re 0.5, “
 ” = Re 2.9, “
 ” = Re 5.8, “
 ” = 10.2, and “
 ” = Re 21.8. For symbols not accompanied by bars signifies a significantly higher concentration than all other time points. Data presented as mean ±SD and P < 0.05.

