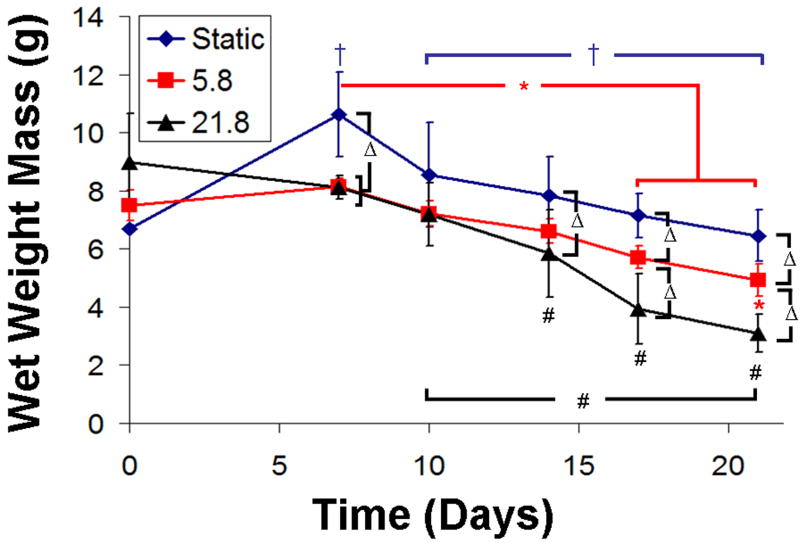
Appendix Figure 2.
Plot of wet weight mass for acellular alginate hydrogels over 21 days of culture. A “ ” denotes a significant difference for static samples compared to 0 day unless otherwise specified, a “
 ” denotes a difference for Re 5.8 compared to 0 day, a “#” denotes differences in Re 21.8 compared to 0 day, and a “Δ” denotes differences between static, Re 5.8, or Re 21.8 for a given time point. Data represented as mean ±SD and P < 0.05.

