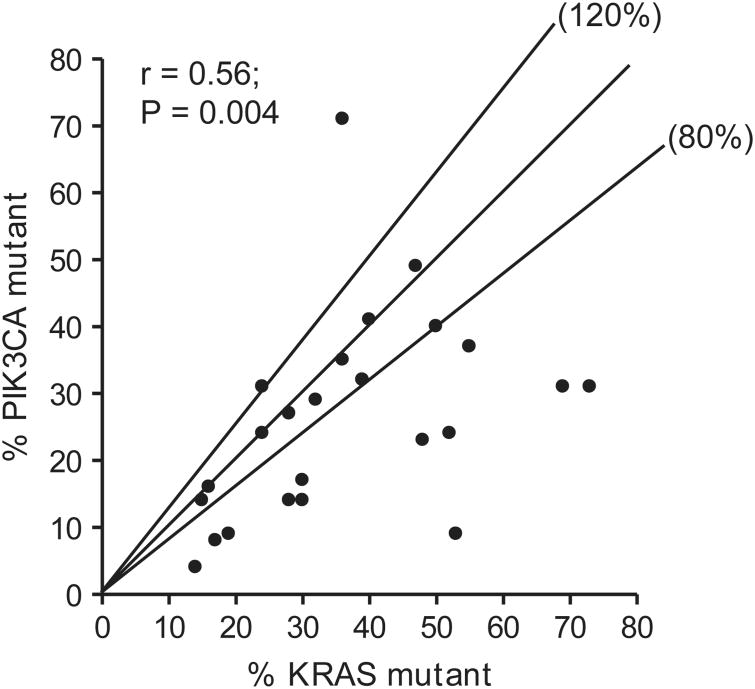
Figure 5.
Correlation of mutant allele frequencies in tumors with concomitant KRAS and PIK3CA mutations. The lines labeled with 80 and 120% indicate the boundary of events with the PIK3CA /KRAS mutant allele ratio between 80 and 120%. Only one PIK3CA mutant allele was included for the three specimens with a KRAS mutation and two PIK3CA mutations, r: Spearman's rank correlation coefficient.

