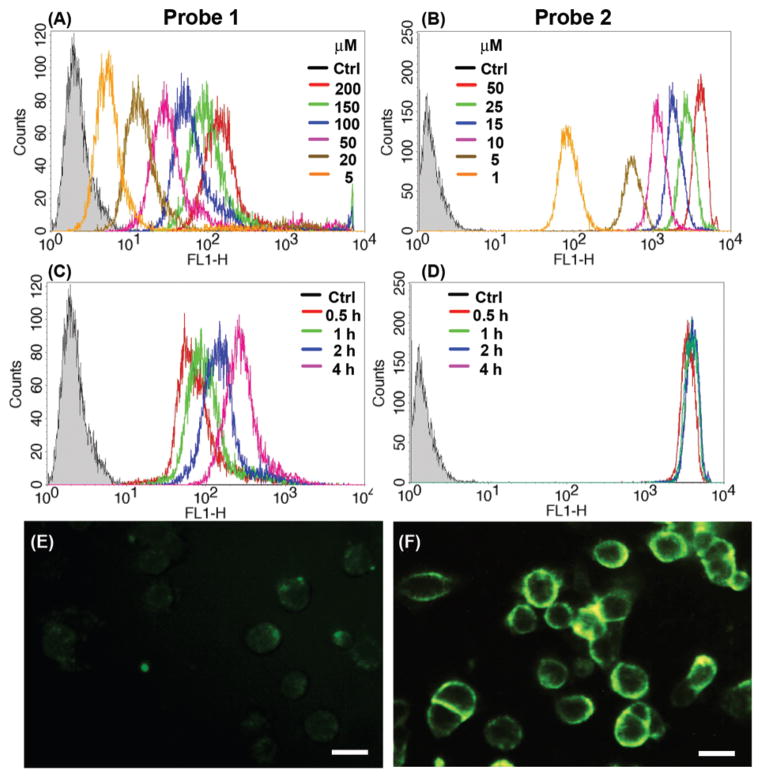
Fig. 2.
Representative flow cytometry histograms of KB-3-1 cells incubated with 1 and 2 to demonstrate the concentration and time dependence. (A) Probe 1 (0–200 μM) and (B) probe 2 (0–50 μM) for 2 hour incubation. (C) Probe 1 (200 μM) and (D) probe 2 (50 μM) for 0.5, 1, 2 and 4 hour incubation. Representative fluorescence images of KB-3-1 cells after incubation with probe 1 (200 μM) (E) and probe 2 (50 μM) (F) for 2 hours. Scale bars are 20 μm.

