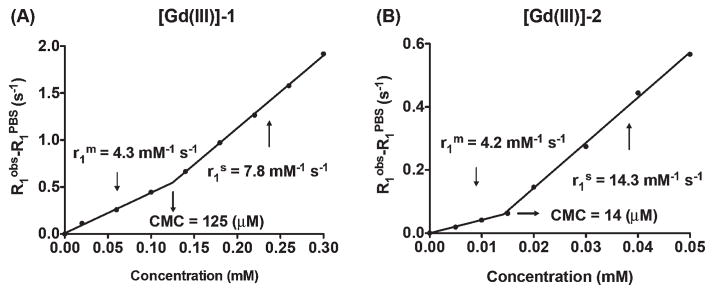
Fig. 3.

The plots of the reciprocals of the T1 relaxation time versus concentrations of [Gd(III)]-1 (A) and [Gd(III)]-2 (B) in PBS at pH 7.4 (25 °C, 1 T). Longitudinal relaxivities r1 were determined from the slope of the linear fits. The CMC of each probe was calculated based on relaxivities of the monomer ( ) and self-assembled nanoprobes ( ).
