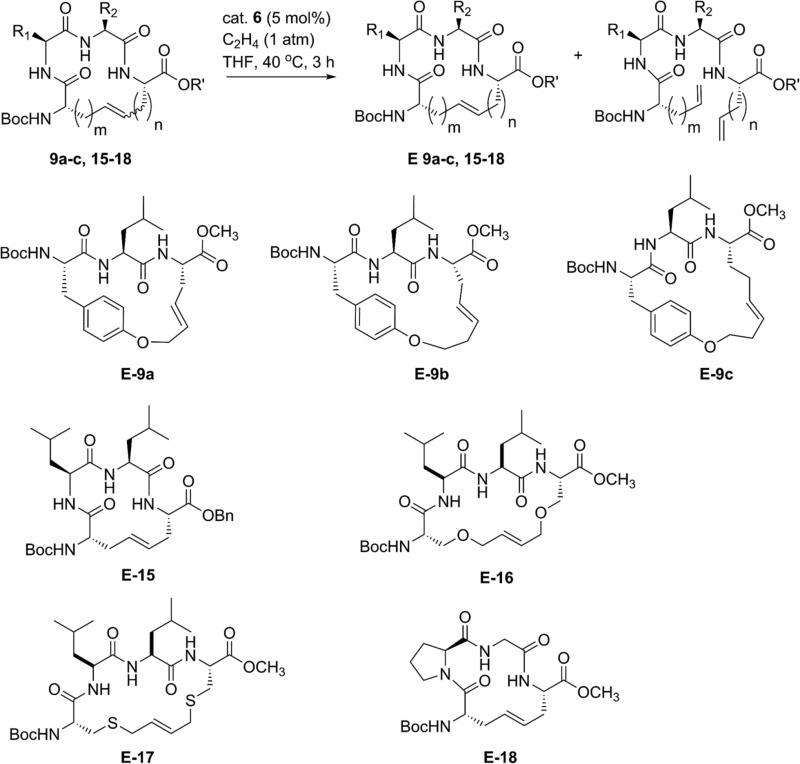
Table 3. Catalyst-controlled ethenolysis for the enrichment of olefin geometry in macrocyclic peptides.

| ||||
| Entry | Compound | Initial E : Z a | Final E : Z a | Yield b |
| 1 | 9a | 96 : 4 | 99 : 1 | 62 |
| 2 | 9b | 80 : 20 | 97 : 3 | 74 |
| 3 | 9c | 82 : 18 | 96 : 4 | 80 |
| 4 | 15 | 90 : 10 | >99 : 1 | 77 |
| 5 | 16 | 81 : 19 | 98 : 2 | 64 |
| 6 | 17 | 90 : 10 | 99 : 1 | 67 |
| 7 | 18 | 77 : 23 | 88 : 12 | 45 |
aDetermined by 1H, 13C NMR spectroscopy and analytical HPLC/MS.
bIsolated yield.
