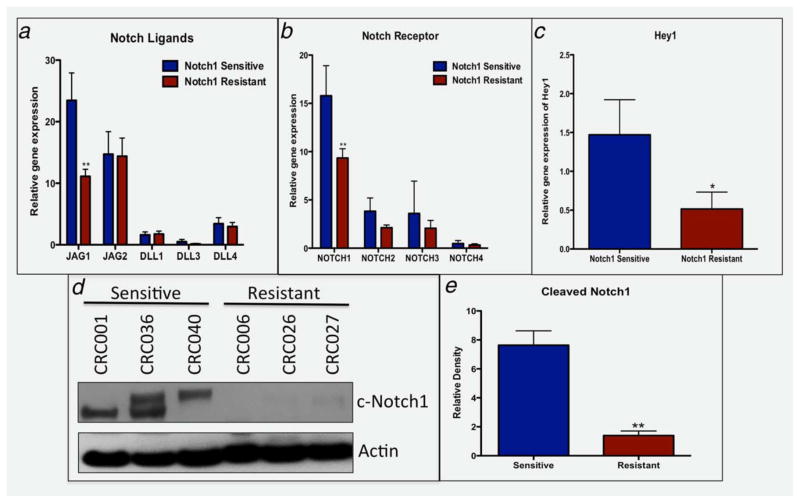
Figure 4.
Notch pathway analysis between sensitive (CRC001, 0034, 036 and 040) vs. 11 resistant tumors. (A–C) RNA Seq analysis of baseline levels of Notch ligands, receptors, and the Notch dependent gene Hey1 showed a significant increase in (A) JAG1, (B) Notch1 and (C) Hey1 in sensitive tumors when compared to resistant tumors. (D) Baseline levels of cleaved Notch1 are elevated in sensitive tumors compared to resistant tumors. (E) Densitometry of cleaved Notch1/Actin ratio showed a significant increase in sensitive tumors compared to resistant tumors (p <0.01).

