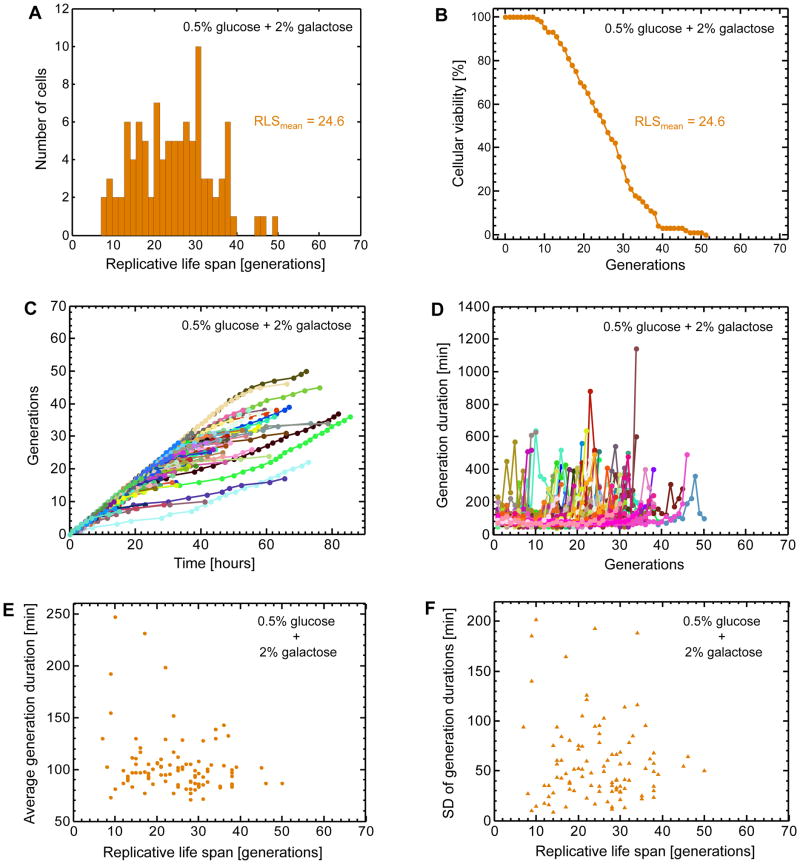
Figure 4. Single-cell lifespan and daughter production duration analyses in the mixed sugar environment.
A. Distribution of replicative life spans (RLS) for 100 mother cells analyzed. The average RLS is 24.6 generations. B. Cellular viability as a function of the number of generations. Cellular viability was defined as the fraction of the initial cells that were still alive at a specific generation. C. Separately for each mother cell, the relationship between the number of generations and time. 100 mother cells (specified by 100 different colors) were analyzed by marking the time points when a mother cell produced its daughters. Each color-coded trajectory corresponds to the entire lifespan of an individual mother cell. Each dot denotes the time point when a daughter cell was separated from its mother. Time t=0 corresponds to the completion of the birth event for each mother cell, after which its first daughter starts to be generated. D. The relationship between daughter production durations experienced by each mother cell and the specific number of the daughter cell it currently generates. 100 mother cells (specified by 100 different colors) were analyzed by measuring their daughter production durations for each passing generation. Each color-coded trajectory corresponds to the entire lifespan of an individual mother cell. Each dot denotes the time it takes for a mother cell (going through a specific generation) to complete generating a daughter cell. E. The single-cell level relationship between average daughter production duration and replicative lifespan. For each mother cell analyzed in (D), daughter production durations were averaged throughout its lifespan. F. The single-cell level relationship between the standard deviation of daughter production durations and replicative lifespan.

