
Figure 6. Comparative analysis of lifespan and oxidative stress in glucose and galactose environments.
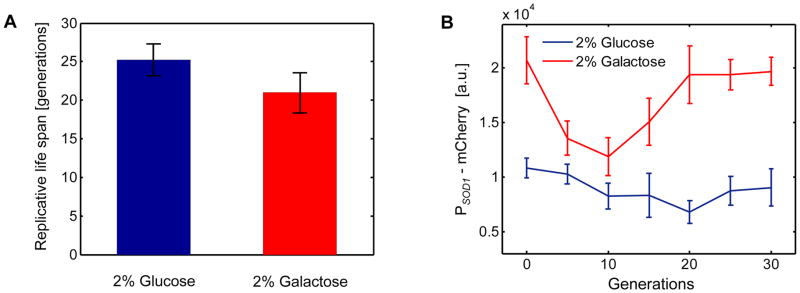
A. Average lifespan is 16.8% lower in the 2% galactose environment (RLSmean = 21.0) compared to the 2% glucose environment (RLSmean = 25.2). Error bars are SEM (N=3 experiments, glucose; N=5 experiments, galactose). B. PSOD1-mCherry levels quantified in aging mother cells in increments of 5 generations. 30 mother cells were tracked in each environment and single-cell mCherry levels from all living cells were averaged at the specific generation points plotted. Error bars are SEM (6 cells ≤ N ≤ 29 cells). For (A–B), the growth environment was minimal media.