
EXHIBIT 3.
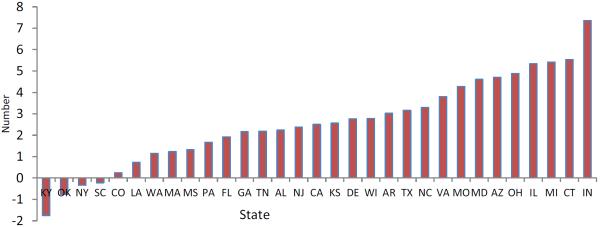
Caption: Difference In Average Number Of Health Care–Related Deficiencies Between Nursing Homes With High Concentrations Of Racial/Ethnic Minority Residents And Those With Low Concentrations By State
Source/Notes: SOURCE Authors' analysis of data for 2010 from the Online Survey Certification and Reporting (OSCAR) file and the LTCFocus file. NOTES States were not included if in 2010 they had fewer than five nursing homes in the group with low (< 5 percent) minority concentrations (HI and NM) or fewer than five nursing homes in the group with high (≥ 35 percent) minority concentrations (AK, IA, ID, ME, MN, MT, ND, NE, NH, NV, OR, RI, SD, UT, VT, WV, and WY). The District of Columbia was also excluded because in 2010 it had fewer than five nursing homes in the high-concentration group.